
Where is the market headed?
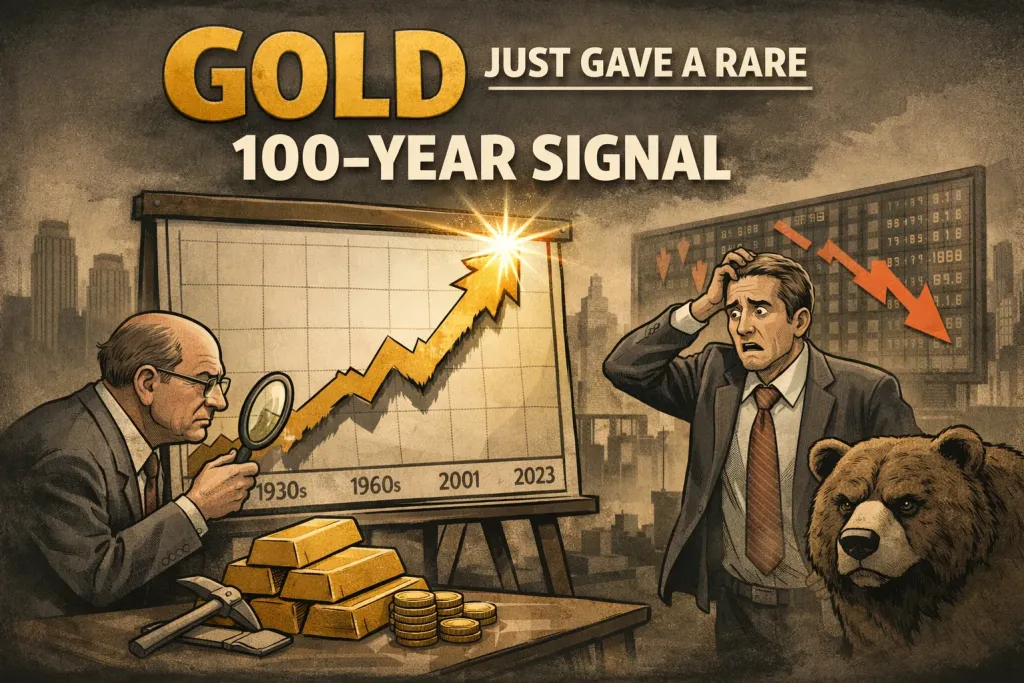
Market dynamics are undergoing a notable shift as key macroeconomic developments unfold. Reports suggest a potential settlement in the Iran-US war within the next 24 to 48 hours, alongside a recent Goldman Sachs report projecting no further interest rate hikes for the remainder of 2026. This shifting narrative has triggered a sudden change across financial markets, causing the US dollar index to fall, US Treasury yields to soften, and gold to rise as part of a classic anti-war trend.
Consequently, precious metals and emerging markets have shown improved momentum over the past 48 hours. Driven by these macroeconomic tailwinds, Indian stock markets appear positioned to approach all-time high levels in the near future. While several market segments have already reached peak levels, remaining market sectors may soon follow.

Market Overview
Focusing on the daily market setup for August 5th, with a standard reminder for readers to fully review all compliance disclaimers before proceeding, the Nifty index stands at the edge of a technical breakout and is currently retesting these levels. Despite closing auction settlement system issues that temporarily affected final price displays, notably where the Nifty was not showing at 24,624 until 15 minutes before the market close, the official closing recorded for

Major Market indices
Nifty settled flat at 24,64, reflecting a minimal move of 0.04%. However, underlying market breadth remained positive, led by strong performance in broader market indices. Small-cap stocks staged a solid run with a 0.7% gain, propelling the Small Cap 100 index to a fresh all-time high, while the Small Cap 250 index trades very close to reaching its own record high. The Nifty Next 50 and Mid Cap indices registered minor gains, whereas Bank Nifty fell 0.29%.

Heat Maps
Market heatmap dynamics revealed that information technology and banking stocks lost ground, though public sector banks and financial services companies gained. The largest share of market gains belonged to the metals and commodities space, accompanied by strong performance in infrastructure and power stocks.
Within the Nifty Next 50 index, metal names surged, highlighted by Hindustan Zinc leaping 6% and Vedanta making solid gains. TVS Motor continued an almost incessant daily upward trajectory, complemented by strong advances in Motherson, Bosch, Tata Capital, Lodha, Pidilite, and IOC.


Top Gainers & Losers


Sectoral Overview
Evaluating sectoral metrics shows the media sector suffering a steep drop of nearly 1.5%. In contrast, metals rallied strongly by 1.7%, autos advanced by 1.2%, and tourism alongside real estate staged a comeback with gains of 0.84%. Looking back over the past month, metals have accumulated a 5% gain, auto stocks are up almost 9%, and real estate has successfully recovered from negative territory.
Nonetheless, Nifty IT still retains the top spot for overall one-month performance.

Sector of the Day
Nifty Metal Index
Benefiting from shifting interest rate forecasts, metal counters including Hindustan Copper, Hindustan Zinc, Vedanta, Welspun, and JSW Steel all advanced in unison as commodities and precious metals regained favor.


Nifty Media Index
Conversely, the media space endured heavy losses, burdened by a second day of crushing blows for Zee Entertainment, along with declines in PVR Inox, Sun TV Network, and Prime Focus.


U.S. Market Update
In international markets, the previous session delivered another positive performance across US equity indices. The Nasdaq jumped 3.32%, completely recovering from recent corrections to hit a new all-time high. The S&P 500 and Dow Jones both advanced nearly 1.7%, while the small-cap Russell 2000 rose 1.85%, proving that the US market continues to push higher despite frequent calls of a market top.
Stock-level price action exhibited extreme volatility reminiscent of altcoin movements: Palantir Technologies surged 29% in a single day, ARM Holdings leaped 17%, and Marvell, Astera Labs, and SanDisk each posted gains of 10% to 12%. This high volatility poses significant trading challenges for active traders while creating sizable portfolio swings for long-term investors.
Nasdaq laggards were scarce, with only minor losses recorded in Amazon, Take-Two Interactive, Coca-Cola, and Intuitive Surgical, some of which feature in systematic US stock investing strategies. US heatmaps reflected overwhelming strength across semiconductor and AI stocks, with solid gains in Microsoft, Google, Apple, and Nvidia, leaving Amazon standing out as a lone losing entity.


Tweet Of The Day
Shifting focus to broader macroeconomic insights, data released by the Patterns handle, citing official Reserve Bank of India figures, revealed that banknotes in circulation totaled 33 lakh crore rupees at the end of 2023. By July 2026, over a span of just two and a half years, that figure surged to 42.3 lakh crore rupees. This data highlights that the money supply in circulation is expanding by 10% or more every year. This ongoing currency creation has direct implications for purchasing power. For instance, when funds are kept in a traditional bank fixed deposit earning a nominal 6.5% interest rate, an initial 100 rupees grows to 106 rupees by year-end.

However, because currency circulation increases by roughly 10%, the effective purchasing power of that original 100 rupees drops to approximately 90 rupees. Tangible asset owners—holding equities, real estate, fine art, or gold—are far better positioned to keep pace with money circulation because those physical and financial assets possess natural scarcity, whereas paper currency can be printed continuously.