
Hypothesis:
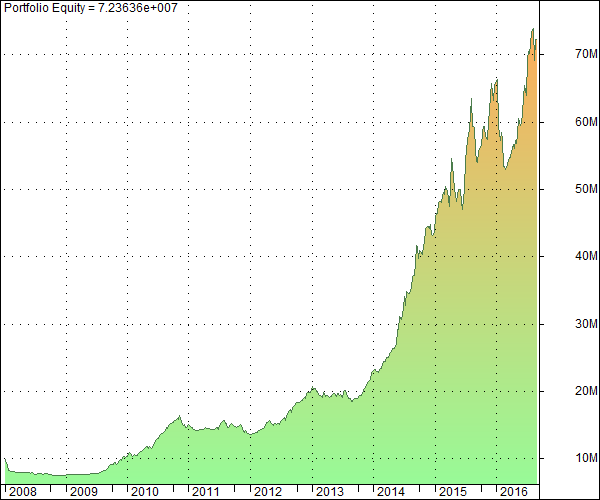
Lets assume mi50 were started on 1 Jan 2008.
By the end of CY 2008, it would have been down by about 24% with max DD at 24.9%.
By end of CY 2009, mi50 would be around 1% net gain, covering all previous losses.
By end of CY 2010, mi50 would be up 50% absolute and 14.6% CAGR.
and so on….
By end of Aug 2016, mi50 would be up by absolute 623%, CAGR 25.6% and max DD still the same at 24.9%
Conclusions:
- If you have confidence in your system, never give up.
- If your system has failed due to changing market, at least give it a chance to perform in one full economic cycle of say 7-8 years
- Add capital after extreme draw down years and reduce/reallocate after good years.
- Even if we did not get the Modi wave in 2014, by end of CY 2013, having gone through one of the toughest 5 yr stock market periods in recent decades, Mi50 would have returned for 2008-2013 an absolute 129%, CAGR 14.8%, Max DD 24.9%.
*Back tests may have testing and survival bias errors. The back test assumes a slippage of 1% per trade and appropriate transaction costs.


0 thoughts on “An eye opening exercise looking back in the past….”