Nifty Next 50: A Closer Look at Market Peaks
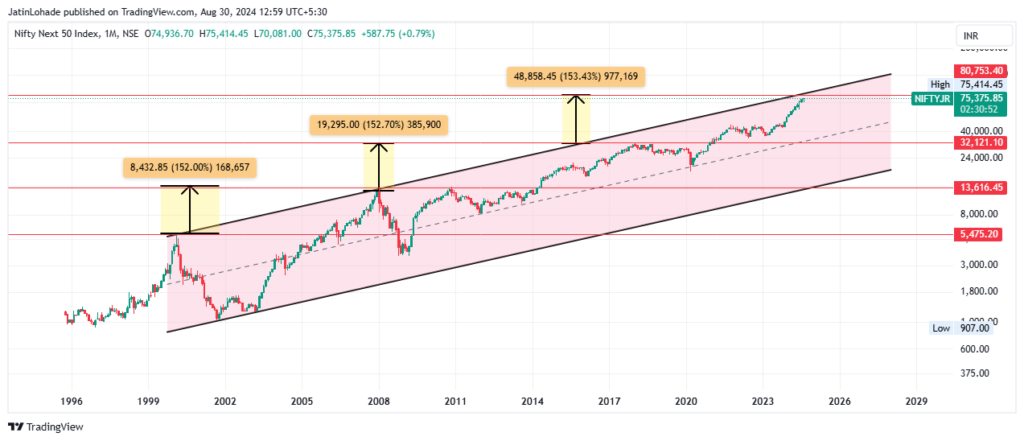
The Nifty Next 50 index has shown some interesting patterns over the years. By analyzing its monthly chart, we can see that it has experienced three distinct peaks in the past, and these peaks may give us clues about future movements. From the year 2000 to the present, the index has followed a general trend where each new peak occurs about 150% higher than the previous one. This consistent growth makes it worth examining closely for investors who want to understand where the market might be heading next.

The 150% Rule and Market Peaks
Looking back at the first peak in the year 2000, Nifty Next 50 was around the 5,500 mark. From there, the next peak happened when the index reached around 13,000, which is roughly 150% higher. The pattern repeated when the index hit its next peak near 32,000, again about 150% higher than the previous peak. Though the last peak didn’t hit the upper channel of the range, it still followed this general trend. If the same pattern continues, we may see the index reach around 80,000 in the near future, given that it currently stands at approximately 75,000.
How Much Higher Can It Go?
According to this pattern, if we assume that the Nifty Next 50 follows its historical trend, we could see a rise of about 7-8% more before the index experiences a temporary rest or correction. While these numbers are based on historical data, it’s important to note that market behavior doesn’t always follow the same script. However, knowing that the index may soon approach another peak can help investors stay aware of potential movements in the market and plan accordingly.
Lessons from Past Corrections
One notable observation from the chart is how the index has retraced its gains during different periods. After the 2000 peak, the Nifty Next 50 saw a significant correction, giving back all of its gains from 1997 to 2000 by 2002. However, in the following phase, the correction was not as severe. From 2000 to 2008, the index gave back around 50% of its gains. In the most recent phase, despite the steep fall during the COVID-19 pandemic, the index experienced only minimal givebacks, showing that the market has become more resilient over time.
The Reducing Givebacks Over Time
It is interesting to note that each market cycle has seen less and less of a retracement after a major peak. This trend indicates that the market has become stronger and more stable as time goes on. While past performance is not a guarantee of future results, the reduced givebacks in recent cycles suggest that the Nifty Next 50 may continue to hold its ground even during periods of volatility. This is a positive sign for long-term investors, as the market appears to be becoming less prone to sharp downturns.
What’s Next for the Nifty Next 50?
While the pattern suggests that the Nifty Next 50 may soon reach an intermediate top, it’s important to remember that no one can predict the future with certainty. Two or three data points alone don’t create a foolproof thesis, but they do provide valuable insights. Whether the market follows its historical pattern or not, it is always a good idea to remain prepared. Investors should be mindful that a potential market rest could be on the horizon, especially after a further 5-7% increase in the index.
Disclaimers and disclosures : https://tinyurl.com/2763eyaz
If you have any questions, please write to support@weekendinvesting.com


