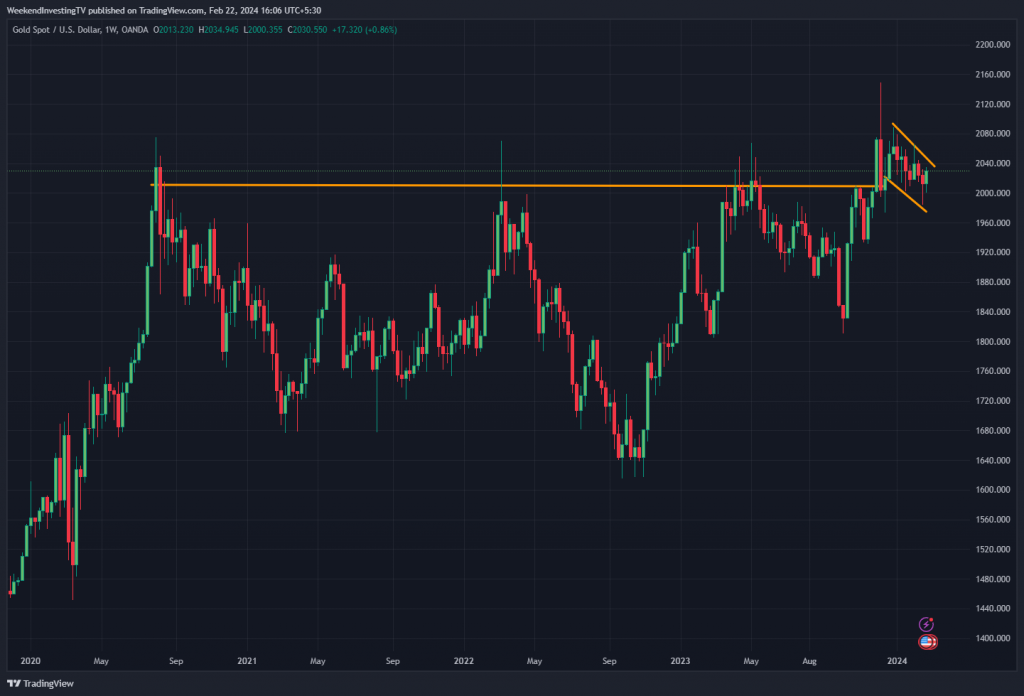
Take a glance at the dollar gold chart, and you’ll notice a fascinating trend that has persisted since August 2020.

Despite fluctuations in other markets, dollar gold has remained relatively stagnant, hovering between $1640 and $2000 for nearly four years. While Indian rupee gold has seen fluctuations due to currency depreciation, dollar gold has remained unchanged, teetering on the brink of a potential breakthrough.
What’s intriguing is the emergence of distinct patterns in the gold chart. One notable pattern is the inverted head and shoulders formation, signaling a potential upward surge beyond $2040 or $2080. Additionally, there’s a flag pattern in the making, hinting at a significant breakout in the near future. As we approach 2024, it’s evident that gold is poised for a defining moment in this decade, potentially marking a significant shift in its trajectory.
The recent years have seen gold undergo a period of consolidation following a rapid ascent from $1300 to $2000 before August 2020. This surge, which yielded returns of 50-60% within a short span, has now given way to a period of digestion. However, this lull is merely temporary, as gold seems primed for another substantial move in the coming years, with projections ranging from 20% to 50% gains.
While these projections are speculative and influenced by personal bias, the underlying factors driving gold’s potential resurgence are clear. With global money printing and mounting debt burdens, there’s a growing consensus that gold is due for a repricing. This sets the stage for a compelling opportunity for traders looking to capitalize on the anticipated surge in gold prices.

Kindly write to us on support@weekendinvesting.com if you have any queries


