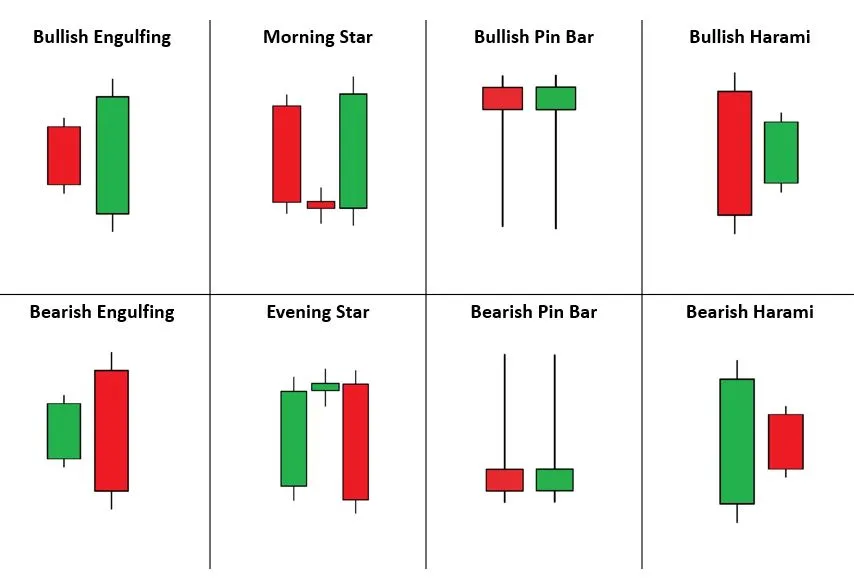
In this article, we will be discussing the popular and most common candlestick patterns that can help you with appropriate interpretations. Candlestick patterns are powerful tools that allow traders to recognize potential market movements and make informed decisions. So, let’s dive right into it!

Bullish Engulfing Pattern
The first pattern we will explore is the bullish engulfing pattern. This pattern occurs when the current period’s candlestick completely engulfs the previous period’s candlestick. Imagine yesterday the market was on a downtrend, and today it opens with a gap down. The market recovers throughout the day, closing higher than yesterday’s close. In this scenario, the bullish candlestick engulfs the entire range of the previous session. This pattern signifies a high probability of further price increases in the market. It indicates a potential trend reversal and suggests bullish sentiment.
Bearish Engulfing Pattern
On the flip side, we have the bearish engulfing pattern. This pattern occurs when the current period’s candlestick engulfs the previous period’s candlestick, but in a downward direction. Suppose the market was previously on an uptrend, but today it opens with a gap up. However, throughout the day, the market reverses its course and closes below the previous day’s range. This bearish engulfing pattern suggests weakness in the market and indicates a potential trend reversal towards the downside.
Morning Star Pattern
The morning star pattern is another popular candlestick pattern that traders often look for. This pattern signals a potential trend reversal from a downtrend to an uptrend. It consists of a strong downward movement followed by a small candle with a limited body at the bottom. The next day, the market experiences a strong upward move. This pattern indicates that the market’s trend may have changed and suggests a short-term bottom. It is called the morning star because it represents a new day and a new beginning for the instrument.
Evening Star Pattern
Conversely, the evening star pattern signals a potential trend reversal from an uptrend to a downtrend. Imagine the market was previously moving upwards, and a small candle with a limited body appears. This candle indicates uncertainty in the market, as it fails to extend beyond the previous upward movement. The following day, the market experiences a significant downward movement. This pattern suggests that a short-term top has been reached and signifies the “evening” for that particular instrument.
Pin Bar Pattern
The pin bar pattern is characterised by a short body and long tails. In a bullish pin bar, regardless of the colour of the body, the lower leg of the candlestick is significantly longer than the upper leg. This pattern indicates that the market is pulling back from the intraday low by a large extent. It shows that the market doesn’t want to stay low and suggests a potential bullish reversal. On the other hand, a bearish pin bar exhibits a similar pattern, but with long upper legs and a short lower leg. This pattern signals bearish sentiment and implies a potential trend reversal towards the downside.
Bullish & Bearish Harami Pattern
Finally, we have the bullish harami pattern, which, despite its funny name, is an essential pattern to recognize. This pattern occurs when a strong downward movement is followed by a gap-up opening and an upward movement that doesn’t cross the previous day’s body. The market closes within the body of the previous day. This bullish harami pattern suggests a likelihood of continued upward movement in the market, despite the previous strong downward day. Conversely, the bearish harami pattern occurs when a strong upward movement is followed by a gap-down opening and a downward movement that keeps the body within the previous day’s body. This pattern signals a potential continuation of the downward trend.

If you have any questions, please write to support@weekendinvesting.com


