Using Simple Tools to Spot Market Trends
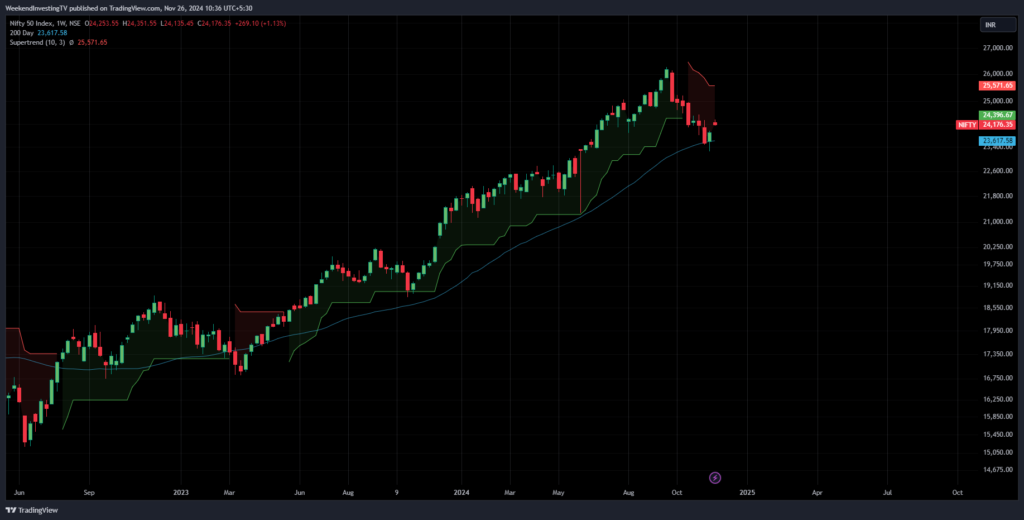
Tracking the stock market can seem complex, but there are some easy-to-use tools that can help investors find the right moments to invest. One popular tool is the 200-day moving average (DMA), which provides a long-term view of how the market is performing. Whenever the market is near or below the 200 DMA, it has often been a good time to invest, especially if you believe in the long-term growth of the market, like in India’s case.

Why the 200-Day Moving Average Matters
The 200-day moving average is a key indicator because it smooths out the daily ups and downs and shows the general direction of the market over time. In the past, when the market has dipped below this level, it has often bounced back strongly. For example, during the COVID-19 crash, the market went below the 200 DMA but later recovered. Many investors see this as a good entry point if they believe that the market, like India’s Nifty index, will grow over the long term.
Using Indicators for Better Insights
In addition to the 200 DMA, there are other simple indicators you can use to gain a better sense of where the market might be headed. One such tool is the Supertrend indicator. This tool helps you see whether the market is in an uptrend or downtrend. For instance, the Supertrend indicator can show green when the market is rising and red when it is falling. By combining the Supertrend with the 200 DMA, you can get a clearer idea of the market’s overall direction.
Recent Market Movements
Looking at recent trends, the market had been in an uptrend from May 2023. However, in late October 2024, the Supertrend indicator shifted to a sell signal, even though the market was still above the 200 DMA. This shift might suggest that the market is losing momentum. If the market breaks below the 200 DMA, it could indicate further declines, making the previous lows, such as those around election day, a key level of support.
Combining Indicators for Better Decisions
By using both the 200 DMA and the Supertrend, you can create your own rules for when to invest. For instance, some investors might only invest when both the Supertrend and the 200 DMA are showing positive signals. Others might decide to add more to their investments when the market dips below the 200 DMA. Whether you prefer to invest in a rising or falling market depends on your personal strategy, but using these indicators can help you make more informed decisions.
The best part about using these tools is that they are available for free. You don’t need to buy expensive software. Platforms like TradingView offer these features at no cost, making them accessible to everyone. By learning to use these basic tools, you can get a better sense of the market’s direction.
WeekendInvesting launches – PortfolioMomentum Report
Momentum Score: See what percentage of your portfolio is in high vs. low momentum stocks, giving you a snapshot of its performance and health.
Weightage Skew: Discover if certain stocks are dominating your portfolio, affecting its performance and risk balance.
Why it matters
Weak momentum stocks can limit your gains, while high momentum stocks improve capital allocation, enhancing your chances of superior performance.
Disclaimers and disclosures : https://tinyurl.com/2763eyaz
If you have any questions, please write to support@weekendinvesting.com


