
The NASDAQ cracked very, very hard last night, down 4%. The S&P 500 also dropped multiple percentage points. Tesla fell 15%, and Amazon, Apple, Nvidia, Palantir were all down in a big way. It seems that liquidity is finally leaving the US markets, at least not going in any further. The Dollar index is collapsing, and US yields are coming down. All this should help India.
We started the day at a gap down, but Nifty recovered entirely, and we ended up where we were yesterday. So, I think for now, we have delinked from the liquidity flow leaving the US, and hopefully, some of that liquidity will come to us in the coming weeks and months.
Today, IndusInd Bank was the talk of the town. It collapsed more than 25% at one point, and it has destroyed investor wealth like nobody’s business. We’ll take this as a case study and walk you through the history of how IndusInd Bank has performed over time. We will also see how it performed versus other banks and how your strategy could have avoided this, despite it being a part of the Nifty50 stocks.
Where is the market headed?
Market Overview
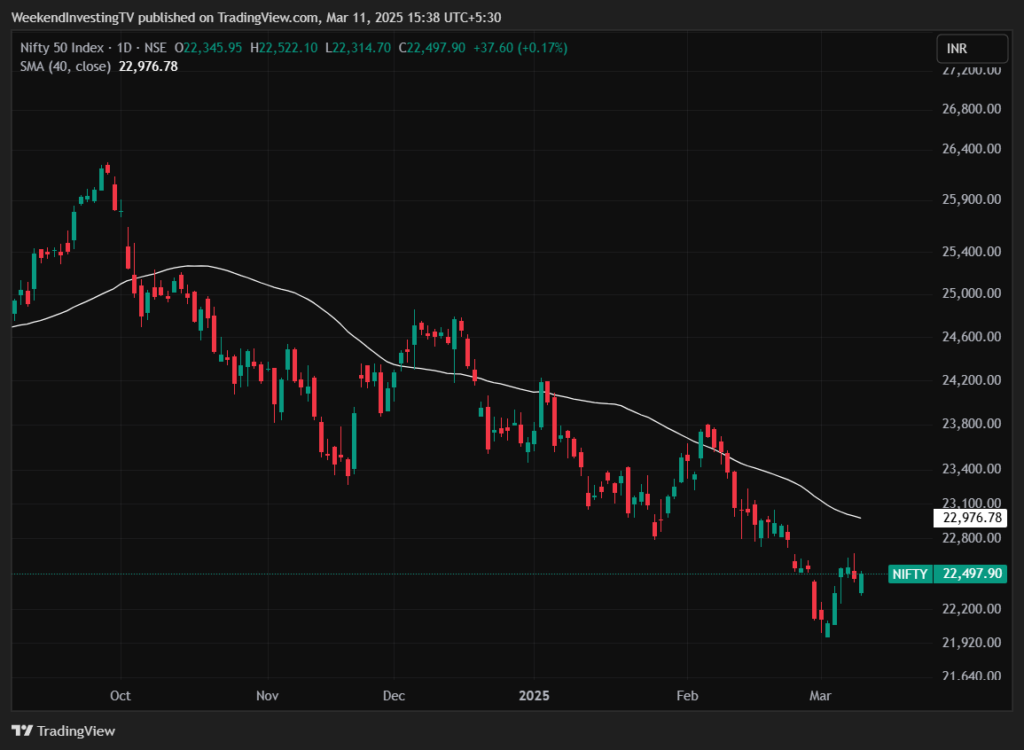
Let’s look at the market. The markets are showing signs of a very healthy pullback. It was up 0.17% at the end of the day, but we started the day at 22,345 and closed at nearly 22,500. So, almost 150 points were gained from the bottom, and that is a very good sign on a day when the rest of the world is bleeding very hard. It does seem like the market is giving a signal that it’s not going to be easy for it to go down further. For now, I think that’s a great signal to get from the market.
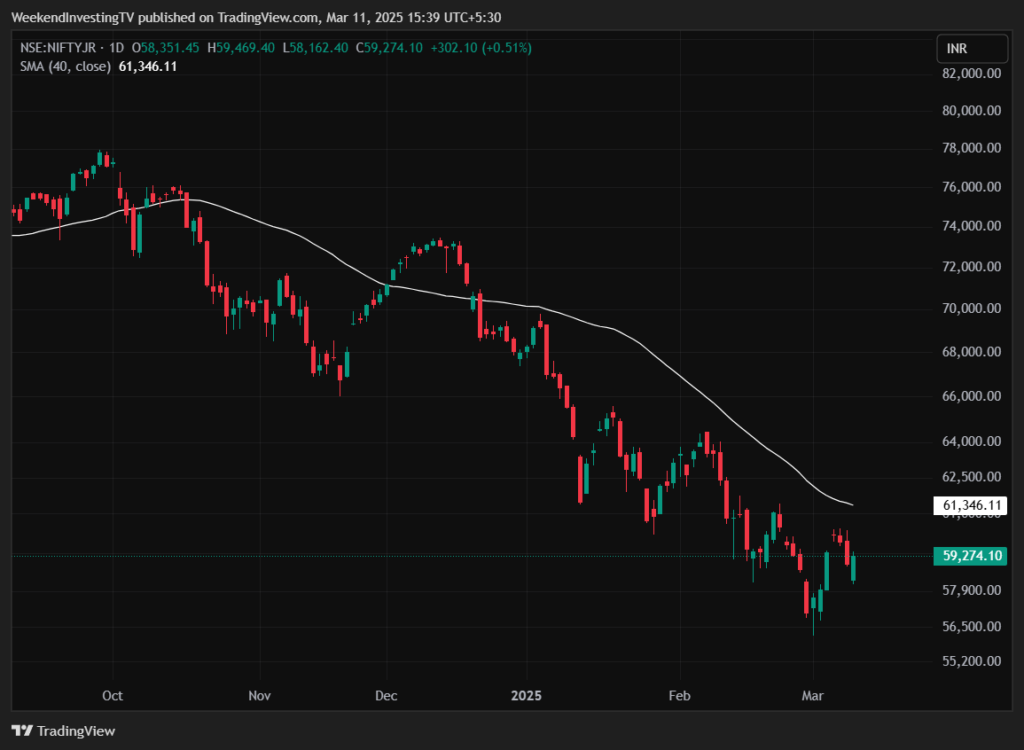
Nifty Next 50
The Nifty Junior also came back from a low of 58,162 to close at 59,274. So, more than 1,100 points were gained from the bottom, and we closed higher than yesterday, up half a percent.
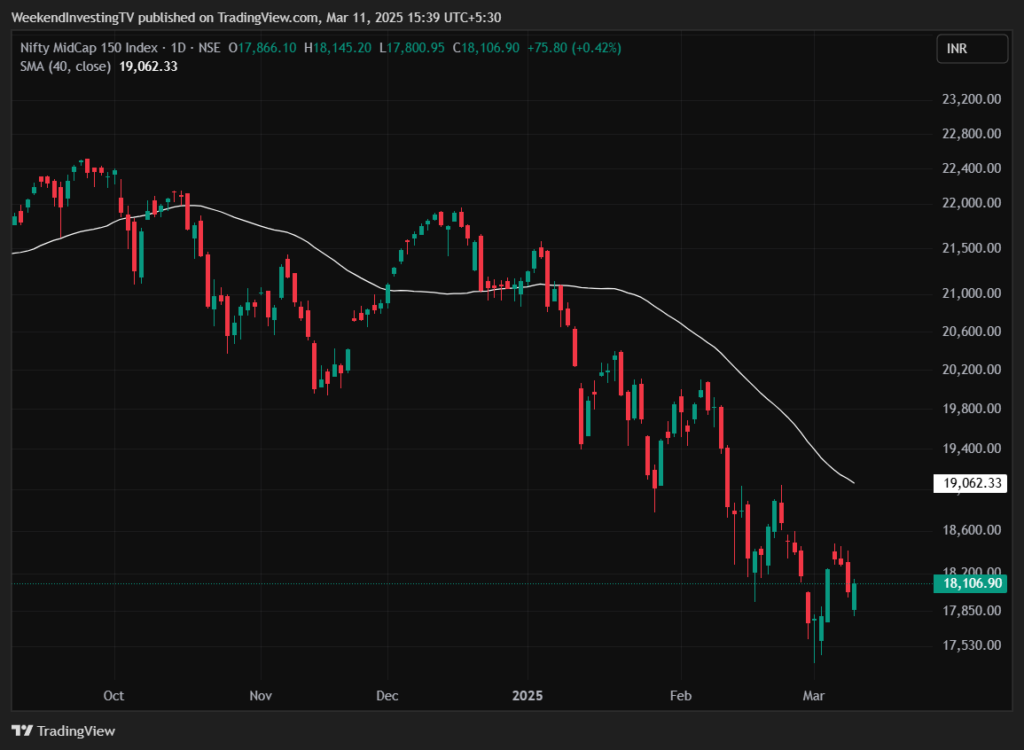
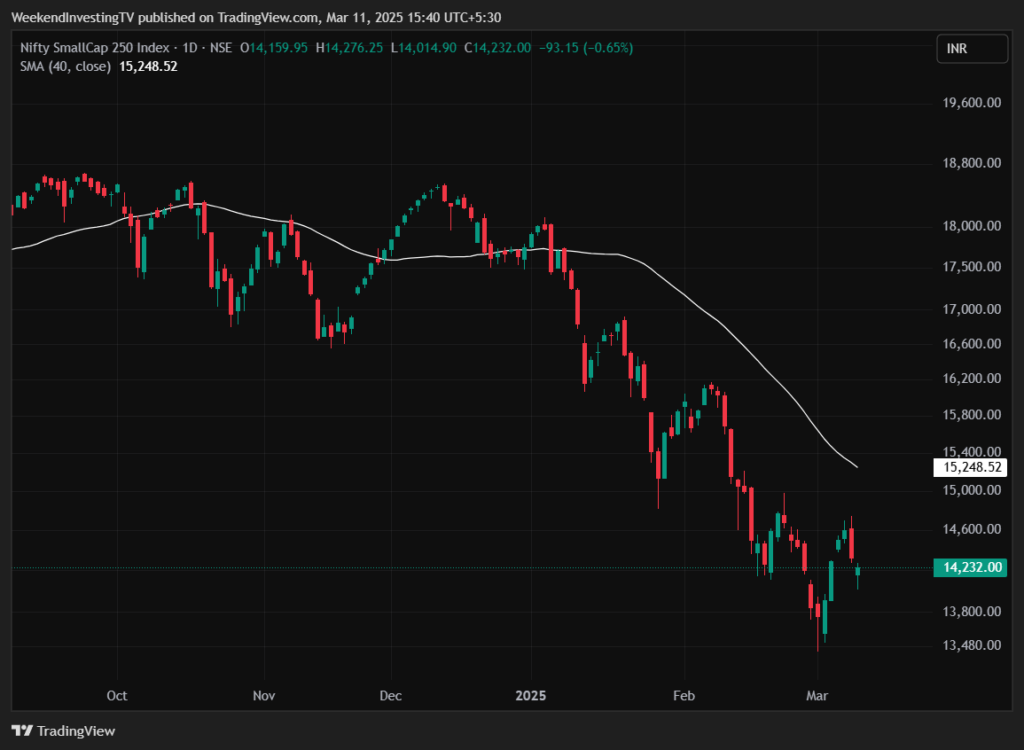
Nifty Mid and Small Cap
The Mid-caps also recovered from the gap, closing 0.4% higher. Small caps didn’t recover like Mid-caps but dropped only 0.65% at the end of the day, which is not so bad.
Nifty Bank Overview
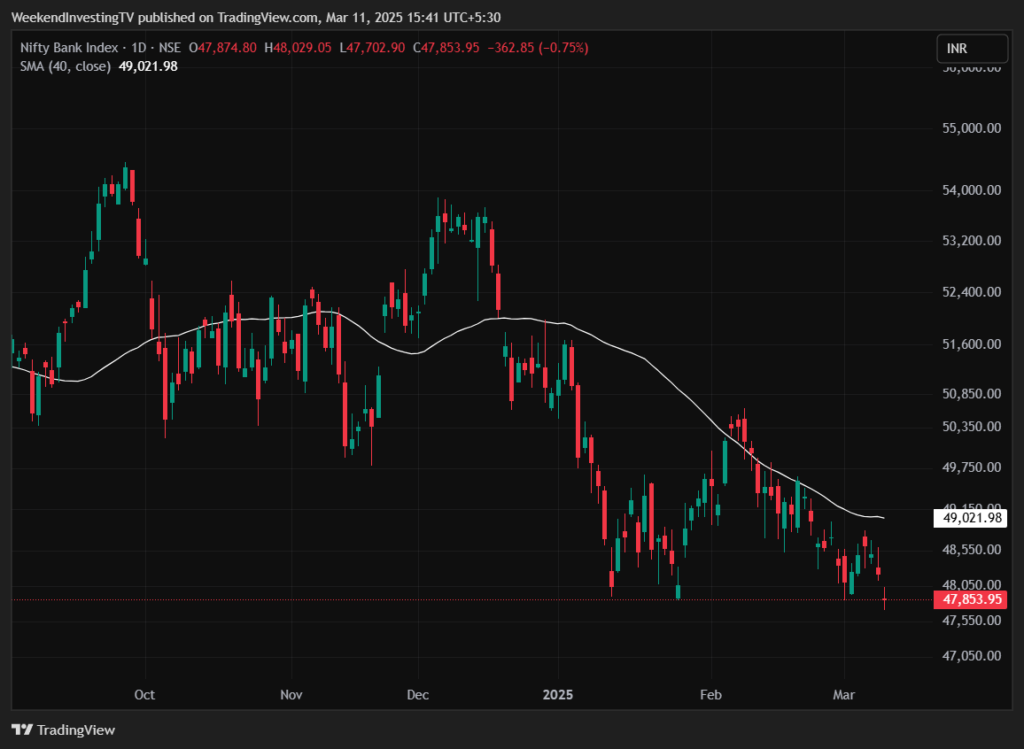
The Bank Nifty, which was majorly hit because of IndusInd Bank, which is one of its components, still managed to close just at the exact support level at 47,850, down 0.75% for the day.
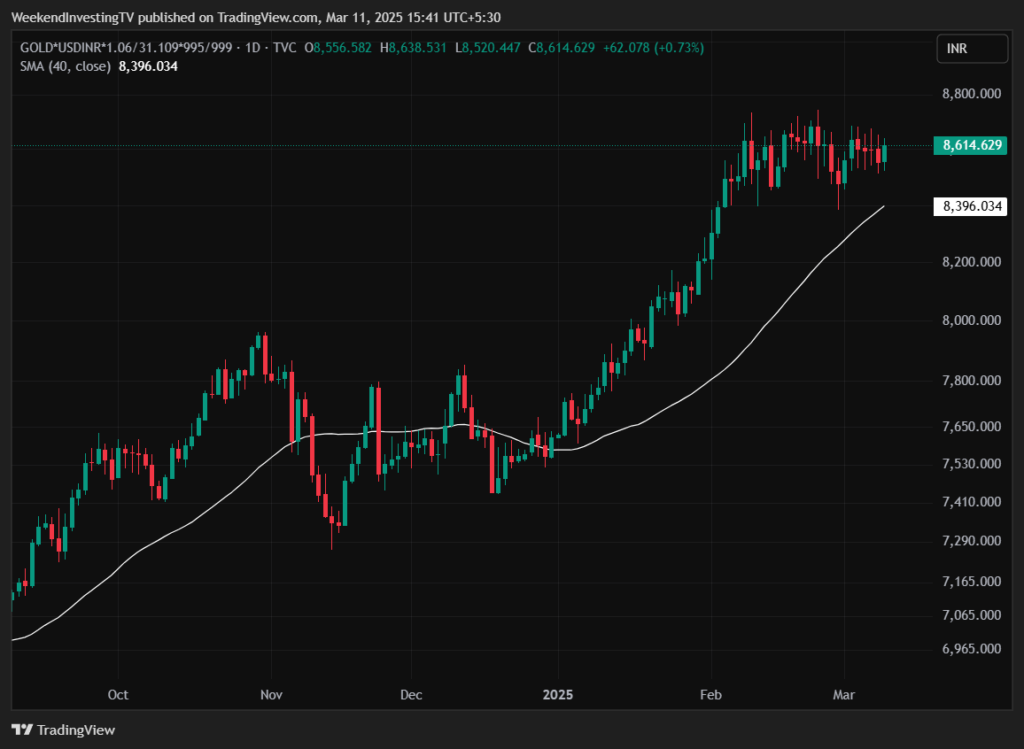
GOLD
Gold is up 0.73% in INR terms. I’m expecting a big move up in gold, but I could be completely wrong. I’m usually wrong about 50% of the time when I try to predict things, and hence, we don’t predict anything when it comes to our strategies.
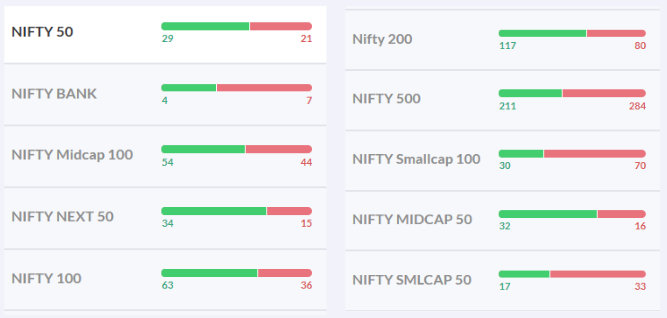
Advanced Declined Ratio Trends
The market breadth was about even in some cases. Nifty 50 was roughly even, Nifty Mid-cap 100 was also even, and Nifty 500 was slightly biased towards the red. Small caps were more red than green, so it was sort of a mixed bag for the day.
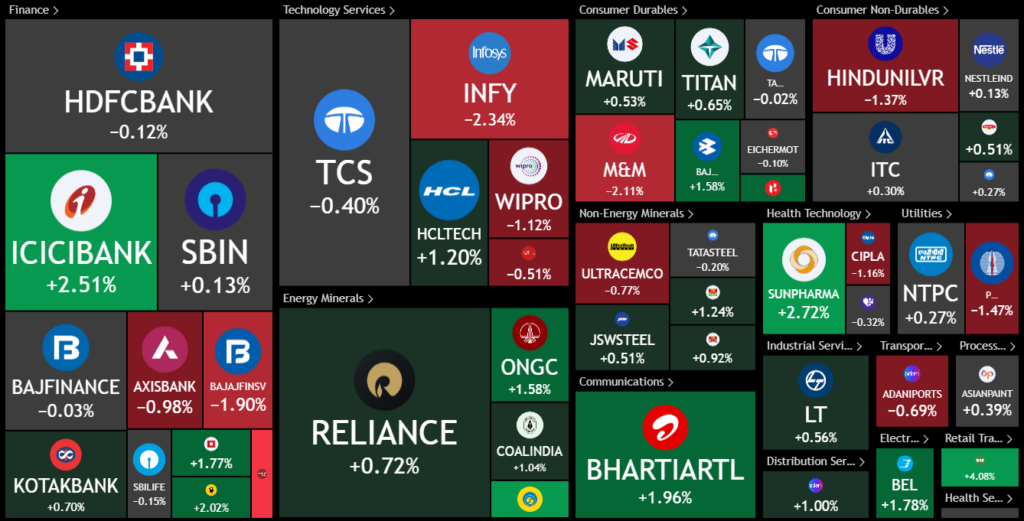
Nifty Heatmap
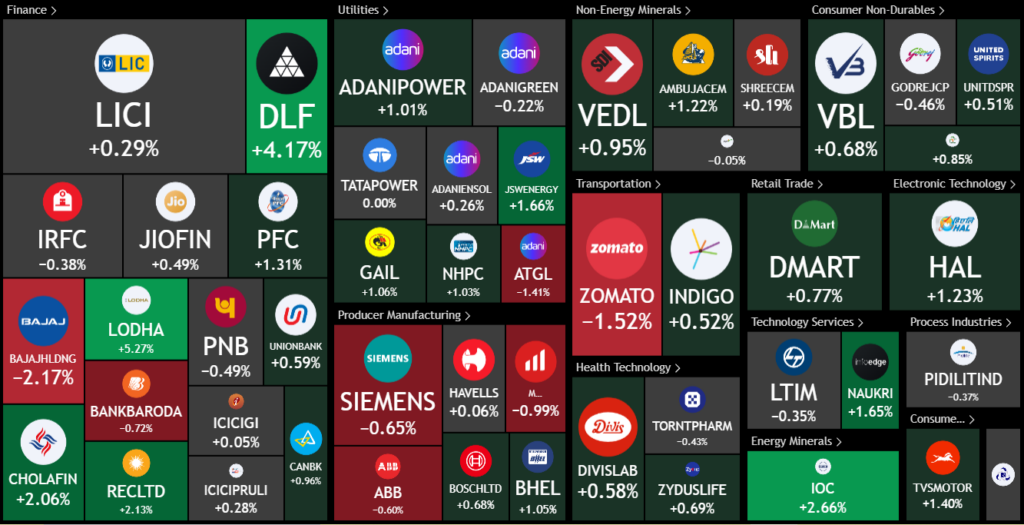
The heat map looked very different in the morning. Everything was red, and you could see big cuts on the screen. But then, big heavyweights were pressed into service, so ICICI Bank, Reliance, Bharti Airtel, Sun Pharma, and Bajaj Auto all helped the Nifty recover.
Although we still had enormous losses in Infosys, Mahindra, Hindustan Unilever, Power Grid, Cipla, Bajaj Finserv, Wipro, Axis Bank, and of course, IndusInd Bank, which I’ll discuss in detail in the second half.
The Nifty Next 50 saw some extremely good moves from sectors like real estate. DLF went up 4%, Lodha was up 5%, and Chola, REC, and PFC, all finance stocks, also went up. IOC, Naukri, and DMart stocks were also up. Zomato recovered from a 4% fall to about 1.5%. Only Mother Son Sumi, Siemens, ABB, and Bajaj Holding also lost some ground.
Sectoral Overview
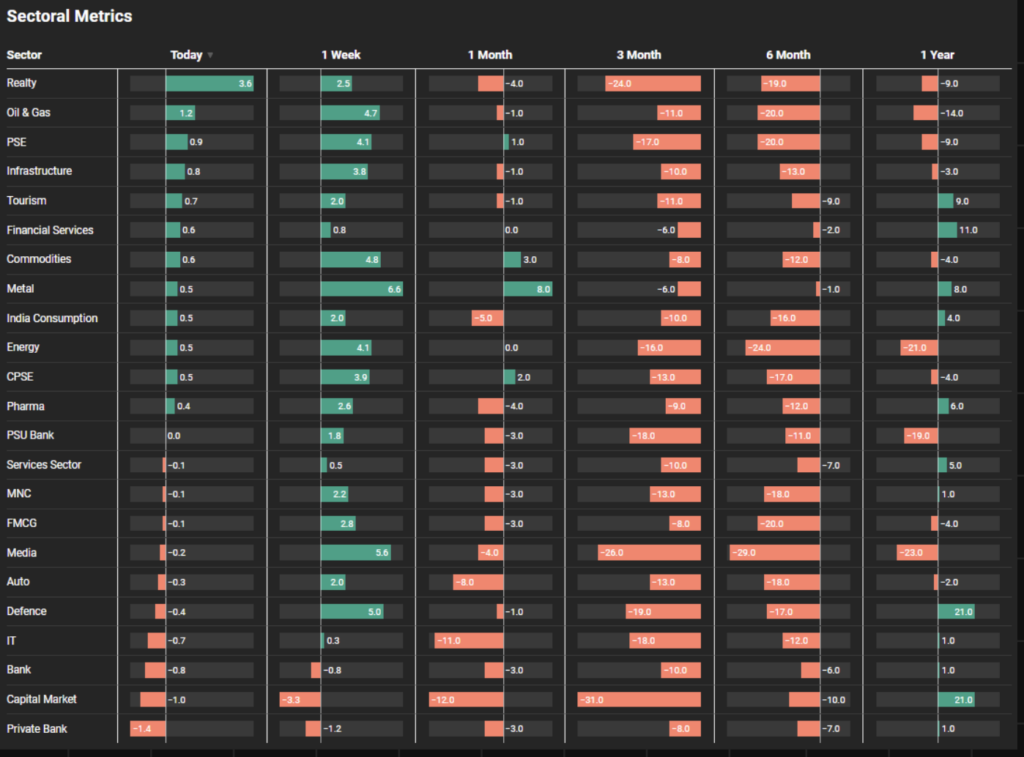
The Real Estate Index was up 3.6% in a single day—a very good move. I would say it’s almost like a bullish engulfing move, and it has reduced some losses for the last month. Over a three-month period, real estate is still one of the largest losers in the market. Oil and Gas gained 1.2%, and public sector enterprises, infrastructure, tourism, financial services, and commodities gained more than half a percent for the day.
The worst hit, of course, was private banks, which were down 1.4% for the day. But private banks have been overall very stable in the last three to six months, with one of the lowest falls among all sectors. Over the last year, private banks have been at the bottom with just a 1% gain. Capital markets continue to bleed, with stocks like BSE, CDSL, and others down by 1%, 3.3% in the current week, 12% in the last month, and 31% in the last three months.
I would have expected capital markets to lead the market down, but it’s coming with a lag. Capital market stocks have really dropped the most in the last three or four weeks. You can see in the last month that capital market stocks are the worst-hit, after IT stocks with an 11% negative return.
Sectors of the Day
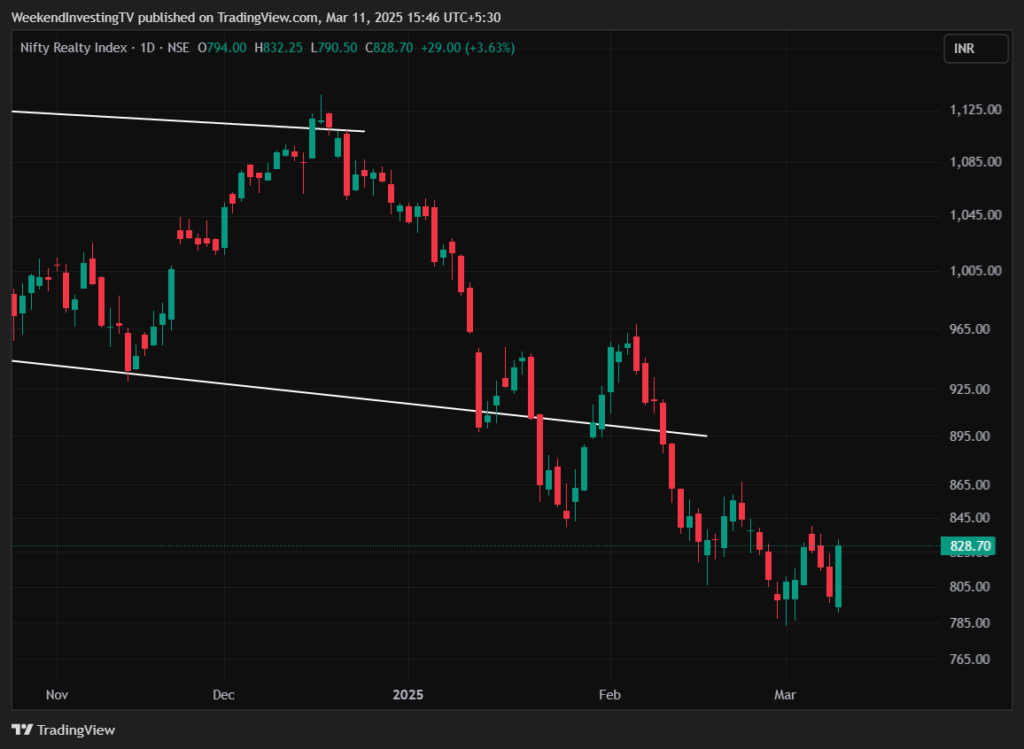
Nifty Realty Index
The real estate index, however, is not making a new low, nor is it gapping down much, showing a very nice comeback. Phoenix Mills, Macro Developers, DLF, Oberoi Realty are doing quite well, although some stocks were still in the red for the day.
Story of the Day : IndusInd Bank destroys investor wealth
Let me put a disclaimer here. I have no beef against IndusInd Bank. I’m not trying to show it in any poor light. I’m using it as a case study to show how investors behave in the markets and how you should not behave. That is the whole point of showcasing this case study.
You probably already know this: IndusInd Bank came out with a release saying that they have about 1,500 crores of derivatives losses that they just discovered. Hence, that loss would amount to about 2.3% of the bank’s net worth as of December 2024. You might think that 2.3% of net worth is gone, which isn’t such a big deal. But banks are leveraged entities, and your net worth is the base on which you create leverage and give credit. So, even a single percent of net worth lost multiplies in a big way, and we lost 27% of IndusInd Bank. In terms of market cap, I think maybe around 40,000–50,000 crores has been lost recently. From the top, they’ve certainly lost somewhere near 70,000–80,000 crores. The market cap of 1 lakh crores has now come down to about 50,000 crores.
Looking at the pattern since October, there was a big gap down that never got filled. This itself was a big indication that the stock was not recovering at all. It hovered around here, and as soon as it got a chance, there was another big gap down. This small candle here was probably the last window of exit for many folks. On February 28, 2025, there was a huge volume candle, which, my suspicion is, was insiders selling, as they knew this was coming. Given the volume candle and the open interest, a lot of people bought puts.
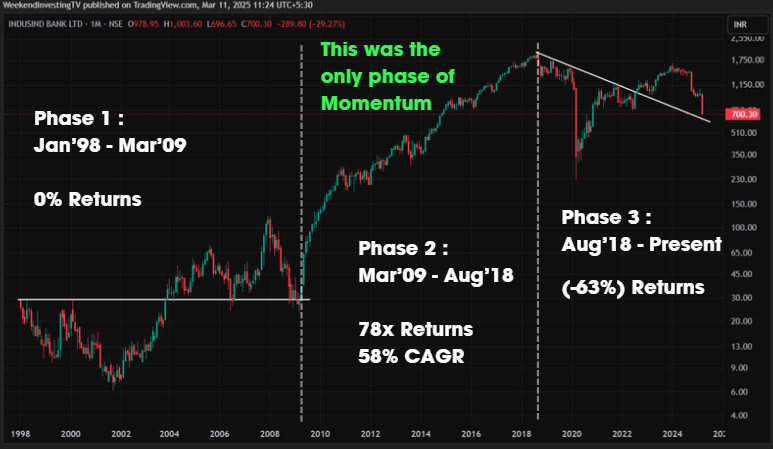
First, let’s look at IndusInd Bank’s performance from January 1998 to March 2009. Despite being in the market for almost a decade post the GFC crisis, there were no real returns. But then the exponential phase started, from March 2009 to August 2018, in the next decade, the stock delivered a 78x return. Can you imagine 78x in one decade? That’s a 58% CAGR for that period. If you came to IndusInd Bank during that decade, you were rewarded like nobody’s business. But then, after August 2018, a huge crisis hit during COVID, which raised questions about the viability of the bank. Yet, capital infusion was done, and confidence returned, with the stock going from 200 to nearly 1,700. Now, we’re down to about 655 at the close, showing a 63% erosion.
When comparing IndusInd Bank with Nifty, Private Banks, and Bank Nifty, you’ll see that it did fantastically well until 2018, with 8,000% gains, compared to Bank Nifty’s 2,300% and Nifty’s 634%. But something happened post-July 2018, and in the last seven years, the bank has given a return of negative 63%. Even before this, if you look at the start of 2024, the bank was still down 20% over the last five years. In comparison, Bank Nifty was up 80%, Nifty Private Banks were up 53%, and Nifty itself was up 98%. Underperformance was extremely obvious, and investors were essentially holding onto hope.
Comparing it with other banking stocks in the last seven years, you’ll find that banks like RBL, Bandhan Bank, and IndusInd Bank have been reeling under underperformance. ICICI Bank, the leader of the pack, was up 332% in the last six years, while HDFC Bank was up 77%.
Now, let’s compare momentum in banking stocks since 2009. In 2008, IndusInd Bank was at the bottom with a -70% return, but as years passed, it moved to the top-performing banks. By 2017, it was among the top three performers. However, after 2018, it started slipping and has been in the bottom rung ever since.
IndusInd Bank was inducted into the Nifty in 2013, and from then, it had a fantastic run, with a 470% return. However, it collapsed again in 2020, and recently, it mirrored Nifty’s overall performance. In the last six months, it’s been performing poorly.
When you invest in Nifty ETFs or mutual funds, you are, by default, investing in stocks like IndusInd Bank because the ETF or mutual fund buys all 50 Nifty stocks. Ideally, you should be buying stocks that are showing strength within the Nifty framework. This is possible only if you actively track the stocks because, like in the case of Yes Bank, Nifty didn’t exit from Yes Bank until it fell from 400 to 25.
Before you decide to enter a stock, ask yourself: What has the stock done to deserve your hard-earned money? It cannot just be hope that it will catch up from past underperformance.
In most strategies, IndusInd Bank has consistently had a low momentum score and would not have been picked in any active strategy. By avoiding such stocks, you will be saved from complete bloodbaths like this. Wealth destroyers will not give you a chance when they are destroying wealth. You need to spot them early, remove them from your portfolio, or they will come and find you.
If a stock goes from 2,000 to 600, that’s not the way to look at it. 600 can go to 300, 300 can go to 150, and so on. At every step, you risk losing 100% of what is left. If that exposure is meaningful to you, then you should be taking charge of it.
If your portfolio isn’t well diversified, you risk being killed when the market drops. Concentrated portfolios look great when stocks are rising, but they are extremely harmful when they fall.
Your portfolio’s health should remain good at all times, and we’ve created a utility to check your portfolio’s health. It can show you the percentage of stocks in strong momentum versus weak momentum, and whether your portfolio is overly concentrated.
WeekendInvesting launches – PortfolioMomentum Report
Disclaimers and disclosures : https://tinyurl.com/2763eyaz


