This week, we are anticipating news regarding a potential Fed rate cut, and the market is eagerly waiting for this update. Recently, each morning has started with a rise, followed by some sell-offs during the day, and today was no exception. There’s ongoing speculation about whether small caps will be able to hold their ground, and whether a correction might be on the horizon given their recent run-up. We will delve into some historical data as well.
Market Overview
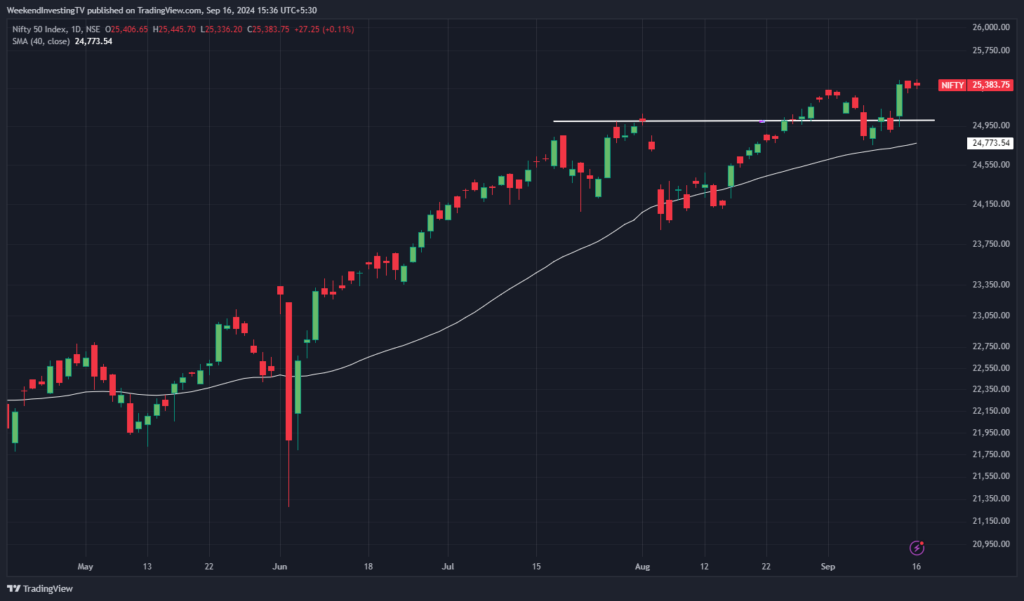
Now, let’s look at where the market is headed. For the second day in a row, the market was relatively flat, up by just 0.11%, and remains near all-time highs as we await the Fed’s decision. Depending on the Fed’s announcement and any subsequent speech, particularly if there is a 0.5% cut and expectations of more to come, we might see a bullish reaction or even a sell-off.
This week is shaping up to be the Fed rate cut week, and until then, we’ll be waiting with bated breath for the outcome.
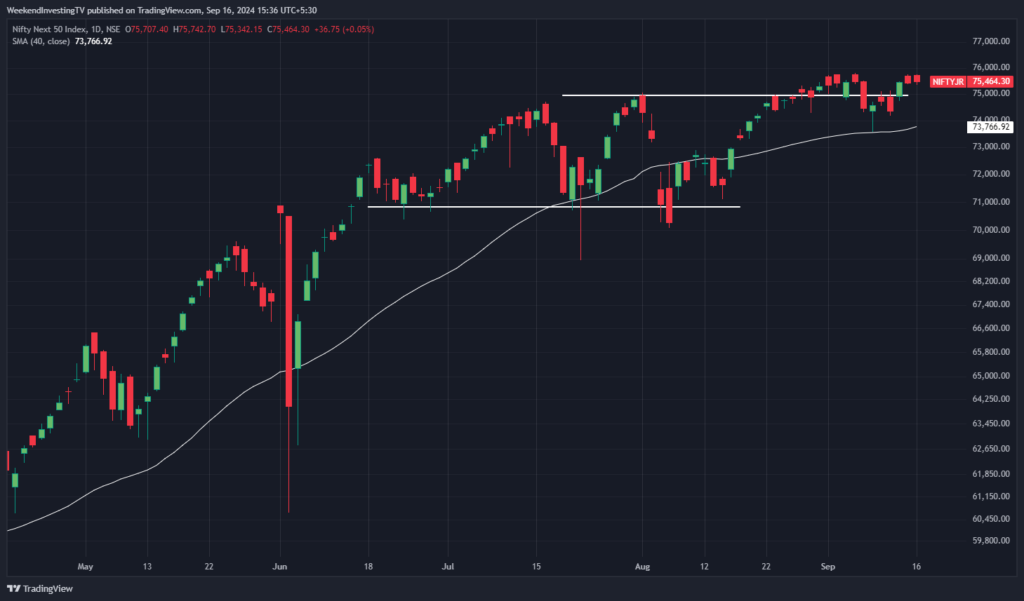
Nifty Next 50
The Nifty Junior also followed a similar pattern, gapping up but giving up most of the gains during the day, ending up 0.05% flat.
Nifty Mid and Small Cap
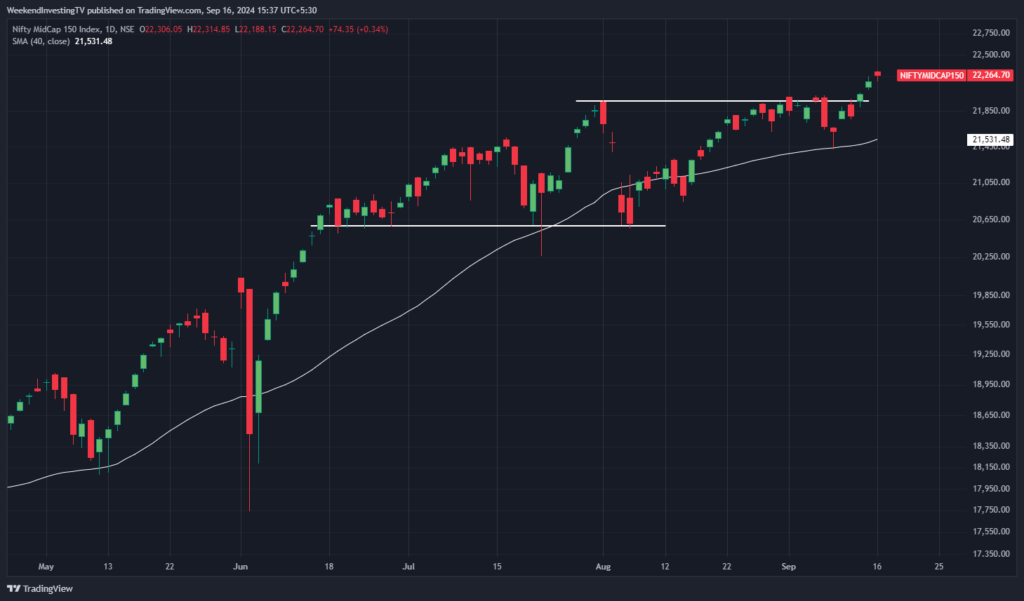
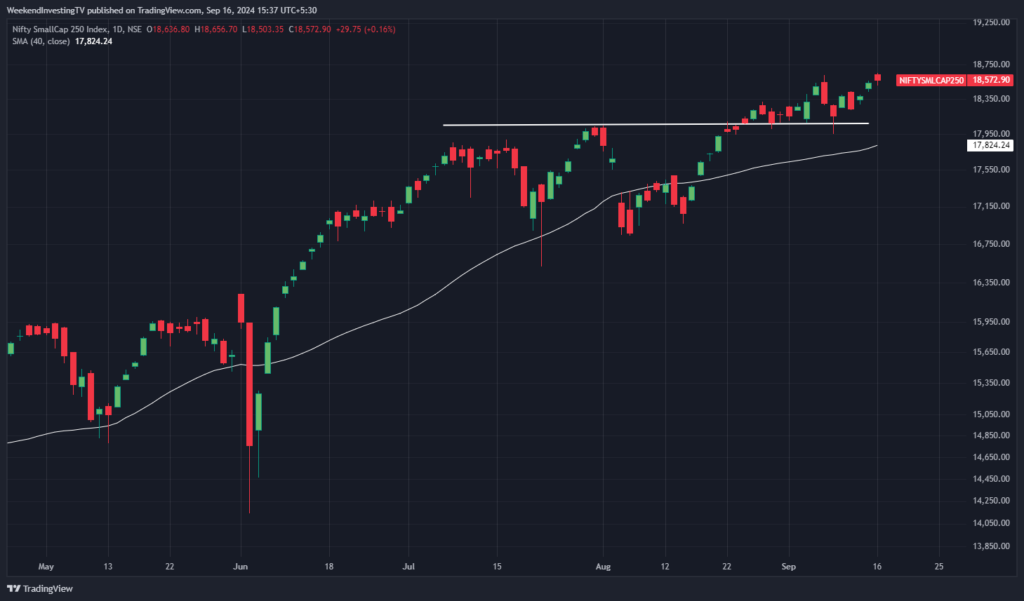
Mid caps, on the other hand, rallied slightly better, gaining 0.34% and reaching a new high on a closing basis. Small caps also opened with a gap up but could not sustain most of the gains, closing up 0.16% at a new all-time high.
Despite the market’s edginess, it remains tentatively placed at previous highs.
Nifty Bank Overview
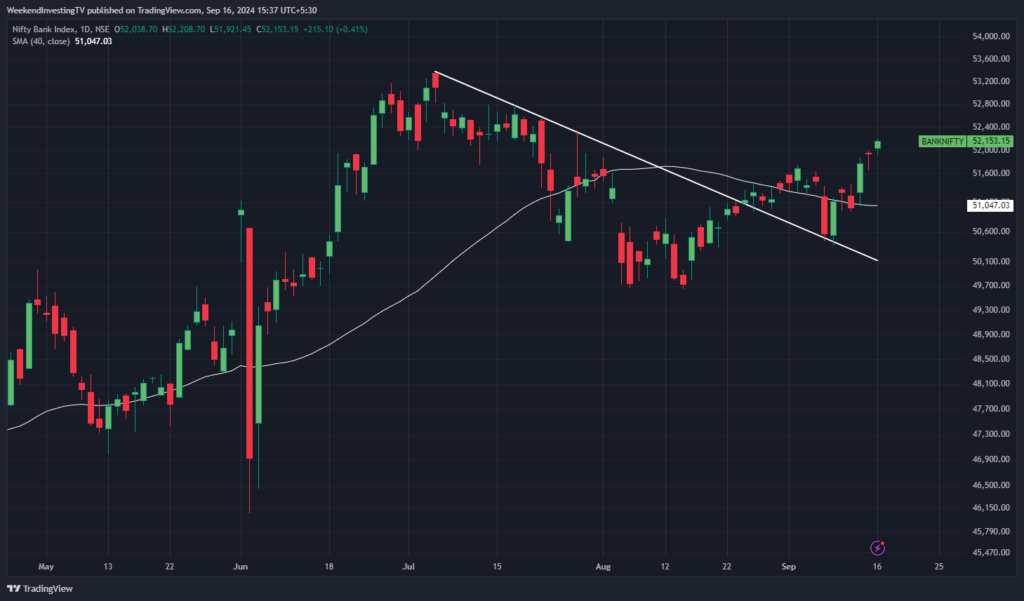
One positive development was Bank Nifty, which decisively broke above its previous pivot, surpassed its average, and broke out of its trend line. After taking a retest, it moved above, signaling the start of a new leg up. Bank Nifty might challenge its previous high over the next few weeks or months, making it a leading indicator for the market’s direction.
The market is also anticipating that the RBI might follow up on the Fed’s cuts with some guidance on interest rate trajectories in India.
Advanced Declined Ratio Trends
In terms of the advanced-declined data on the CNX 500 index, the numbers were fairly balanced, with 227 gains versus 273 declines. This index includes 501 stocks, and the advanced-decline ratio helps gauge the overall market sentiment.
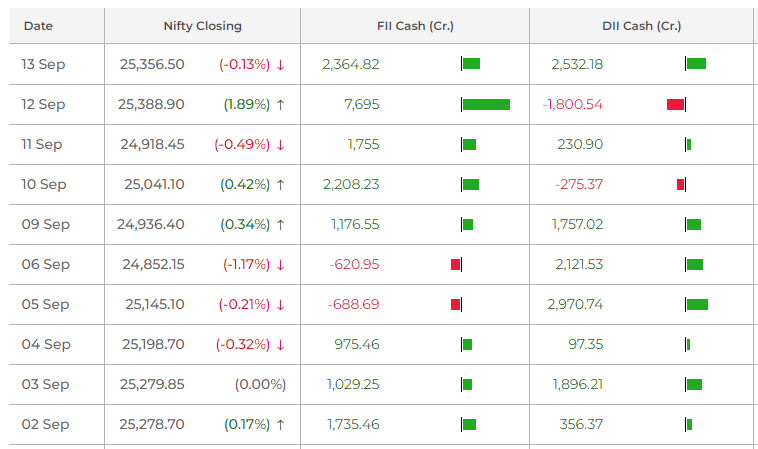
FIIs (Foreign Institutional Investors) have continued their buying spree, and DIIs (Domestic Institutional Investors) also made significant purchases on 13 September.

Nifty Heatmap
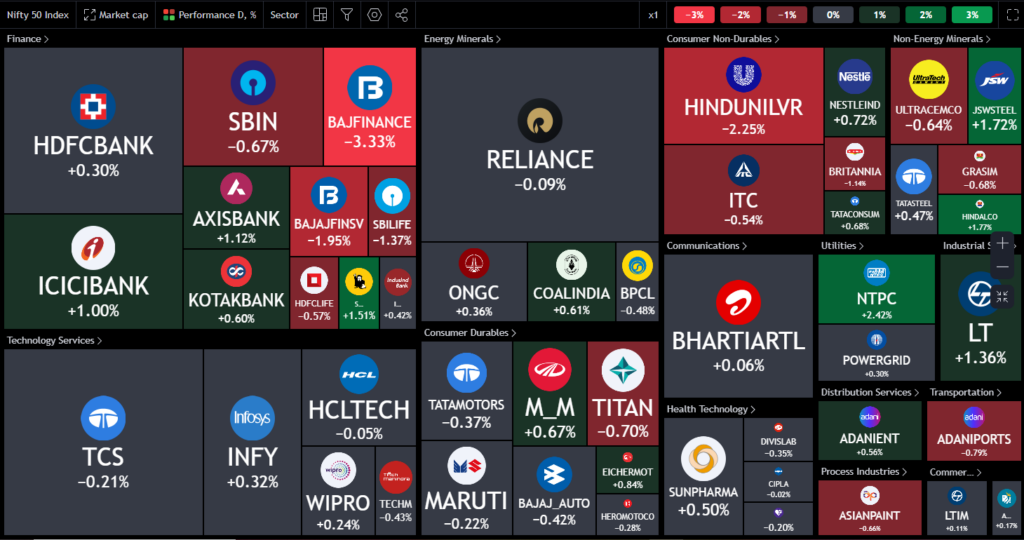
For the past ten days, market activity has been on the buy side, which is generally positive news. Some stocks saw profit booking, including Bajaj Finance, Hindustan Unilever, Bajaj Finserv, SBI, ITC, Asian Paints, Titan, UltraTech Cement, and Grasim. Meanwhile, ICICI Bank, Axis Bank, Kotak Bank, JSW Steel, Hindalco, NTPC, and L&T performed well across various sectors.
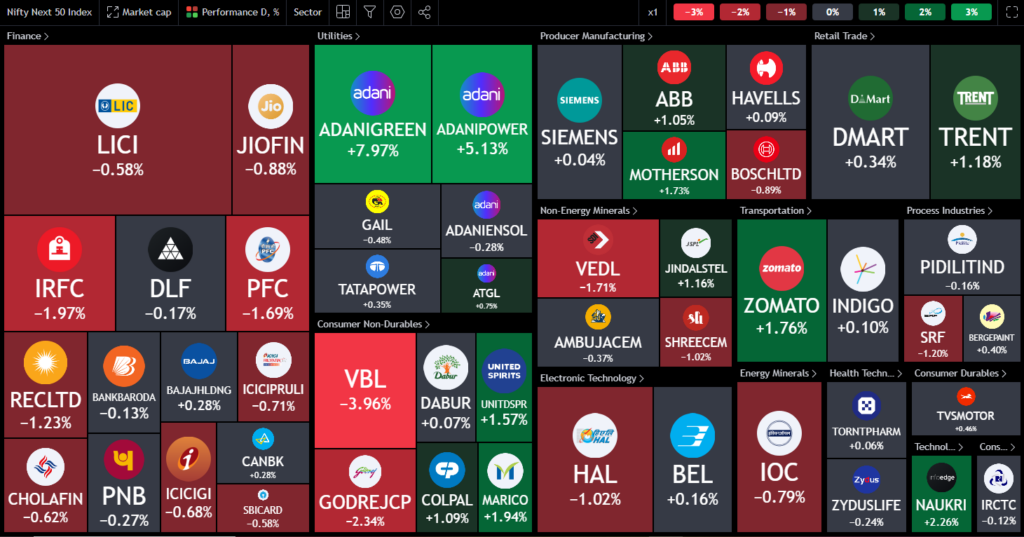
Within the Nifty Next 50, Varun Beverages lost 4%, and Vedanta fell nearly 2%. Public sector enterprise stocks, including public sector banks, did not participate in the rally. In contrast, Adani stocks gained significantly, with Adani Green up 8%, Adani Power up 5%, and other notable gainers including Trent, Mother Son, Zomato, Naukri, United Spirits, and Marico.
Sectoral Overview
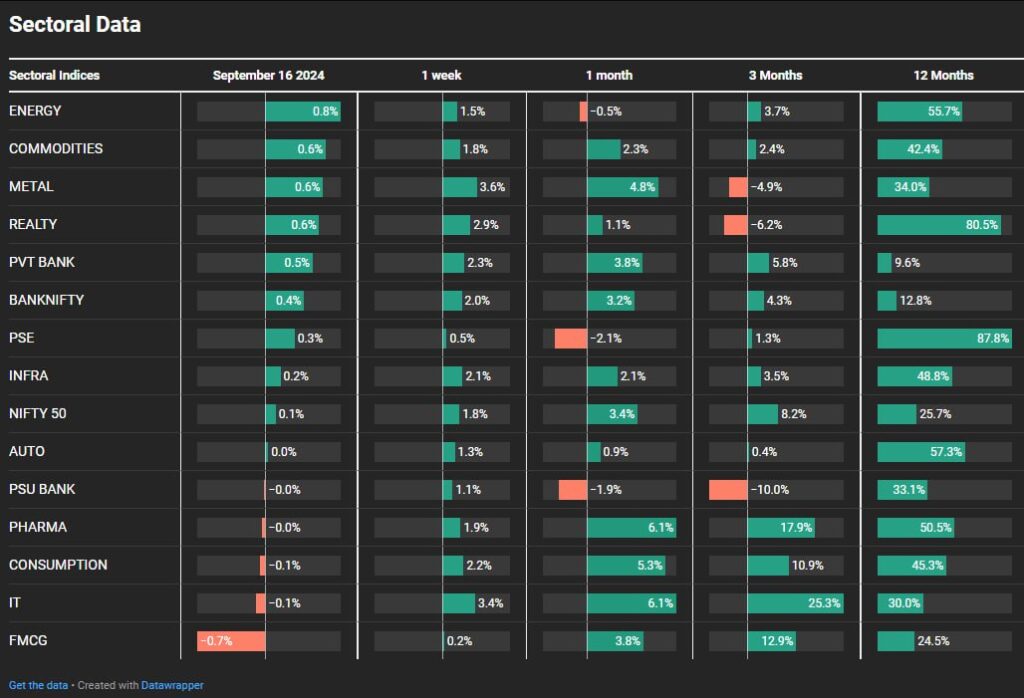
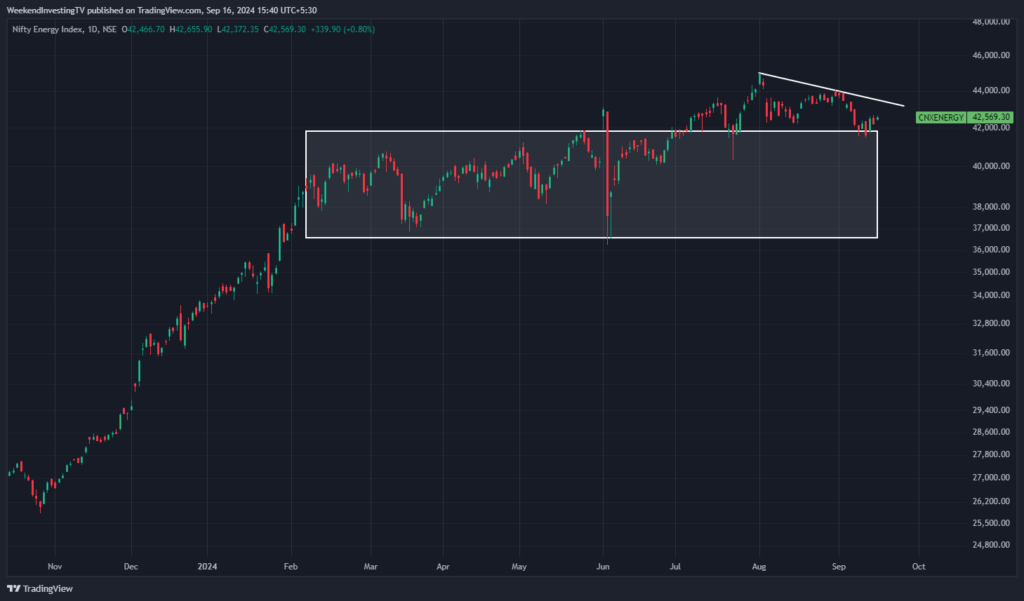
Energy stocks saw mixed performance, with the energy index still struggling, though NTPC, Coal India, ONGC, Tata Power, and Power Grid were trading up.
Sectors of the Day
Nifty ENERGY Index
Stocks of the Day
BSE LTD.
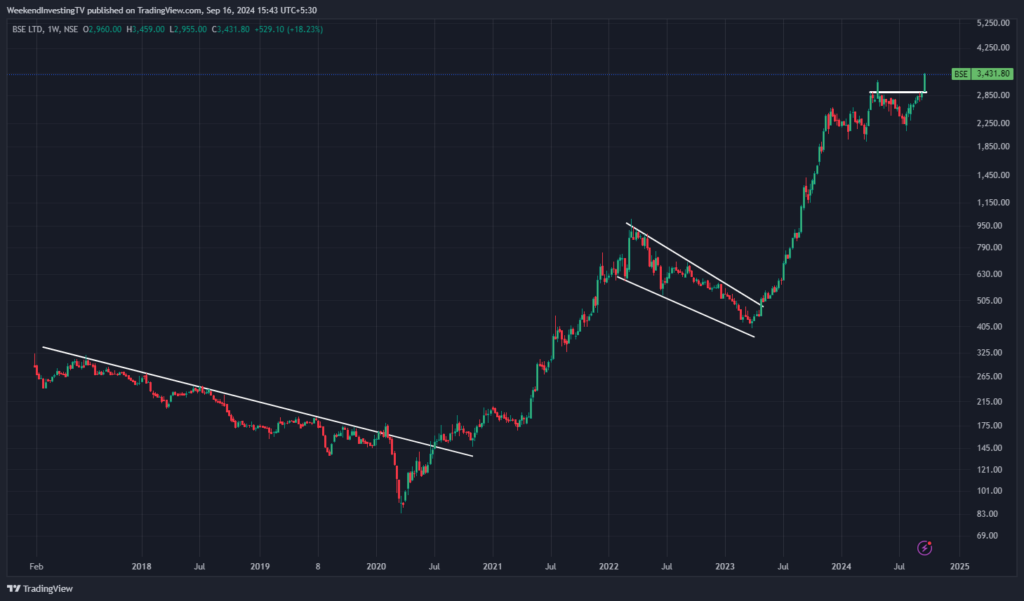
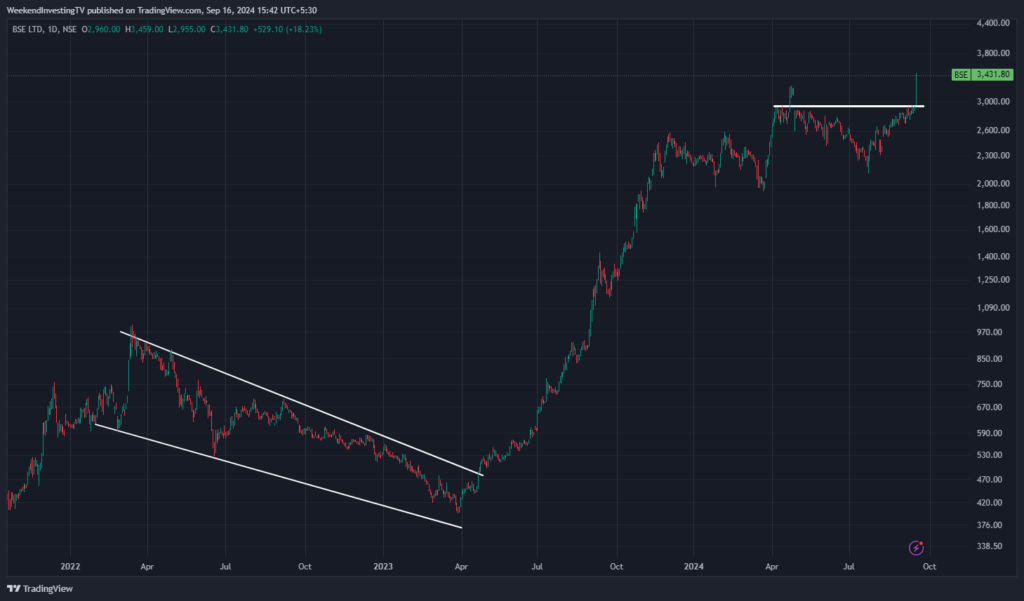
In terms of stock spotlight, BSE Limited saw an impressive 18% rise today. This surge was fueled by rumors of SEBI clearing the NSE’s IPO pipeline, which could introduce more competition in the market. BSE’s remarkable recovery, trading now at Rs 3,400 compared to under Rs 100 four years ago, reflects its strong performance.
Story of the Day
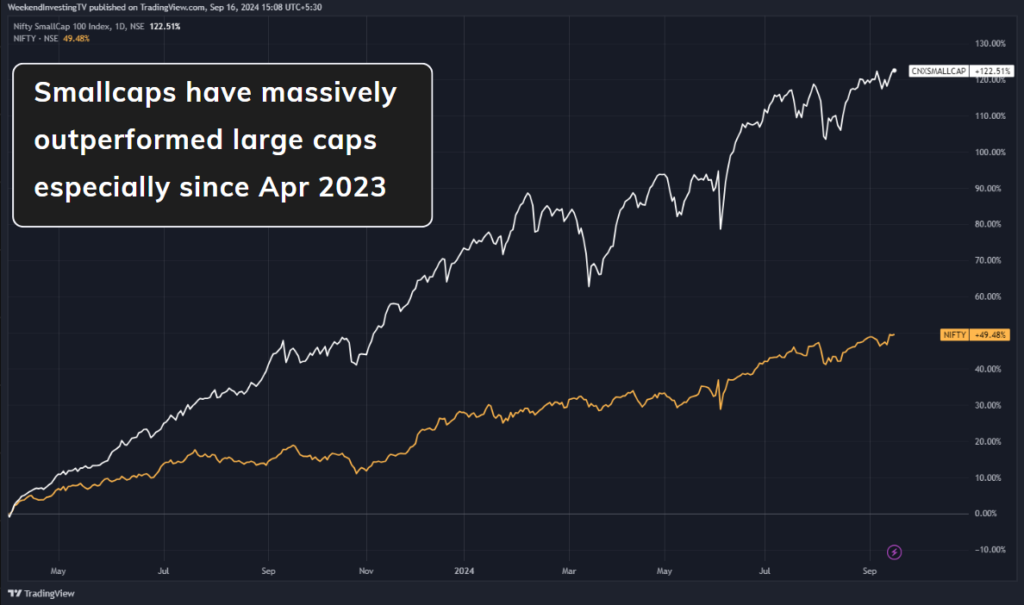
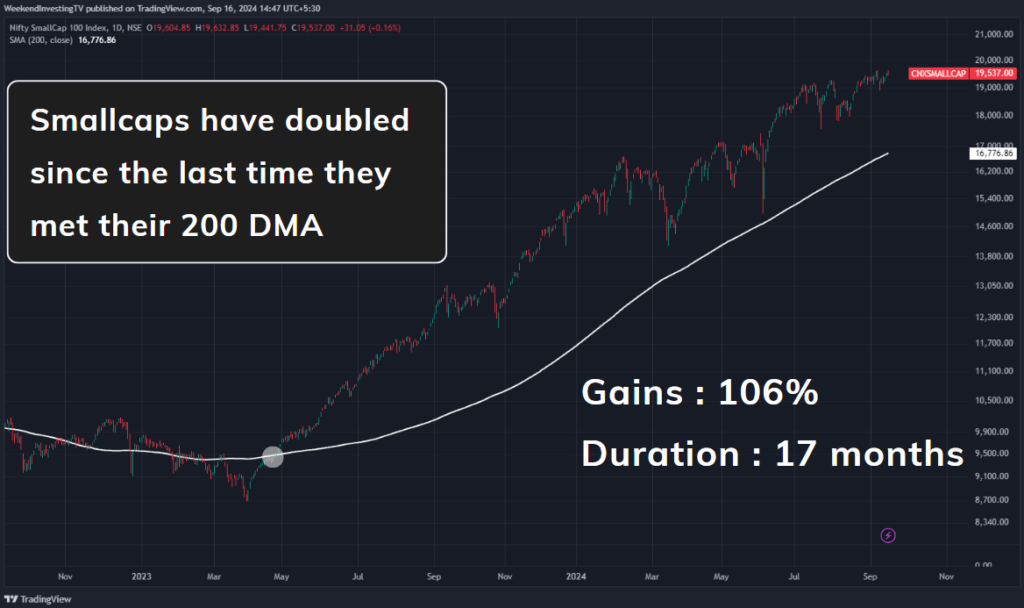
Now, addressing the potential for corrections in small caps, which have significantly outperformed large caps over the past year and a half. Since April 2023, small caps are up 122% while Nifty has gained 49%. Small caps have also doubled since the last time they touched the 200 DMA (200-day moving average) in May 2023, with gains of 106% since then. There’s always a possibility of revisiting the 200 DMA, which currently stands around 16,700-17,000, about 10-12% away from current levels.
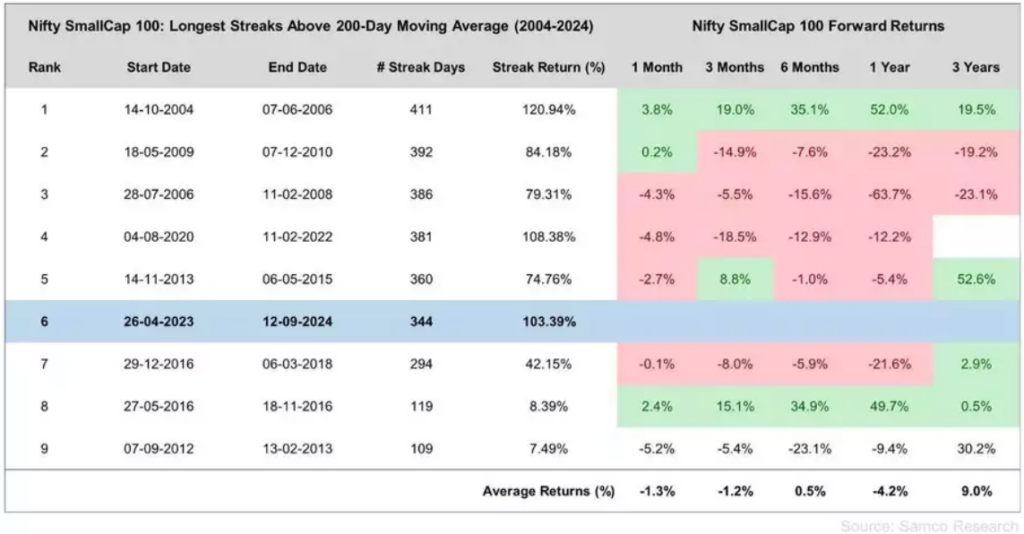
Historically, whenever the small-cap 100 index has closed below its 200 DMA, the forward performance has varied. The longest streak above the 200 DMA in the last 20 years was 411 days from 2004-2006. We are currently at the sixth position with 344 days since April 2023, with previous gains ranging between 80% and 120%. While these figures indicate strong performance, they also suggest that a return to the 200 DMA could result in consolidation or even a decline, with an average forward return of around 9% over three years.
It’s essential to understand that predicting the extent of bull runs is challenging. Markets can remain irrational, and past performance does not guarantee future results. Large inflows into small and mid-cap funds often occur at market peaks, driven by less seasoned investors who may enter the market during high periods of performance. If corrections occur, the impact on these investors can be significant, especially if they lack a clear strategy.
For those invested in small caps, it’s crucial to have a well-defined strategy for various market scenarios. This includes deciding in advance how to handle potential downturns and ensuring proper diversification across asset classes. Effective portfolio management involves planning for worst-case scenarios and avoiding the common pitfall of making decisions based on advice received during market highs. Preparing for market corrections, maintaining a disciplined strategy, and having clear exit plans can help manage the risks associated with investing in small caps.
