Market Outlook
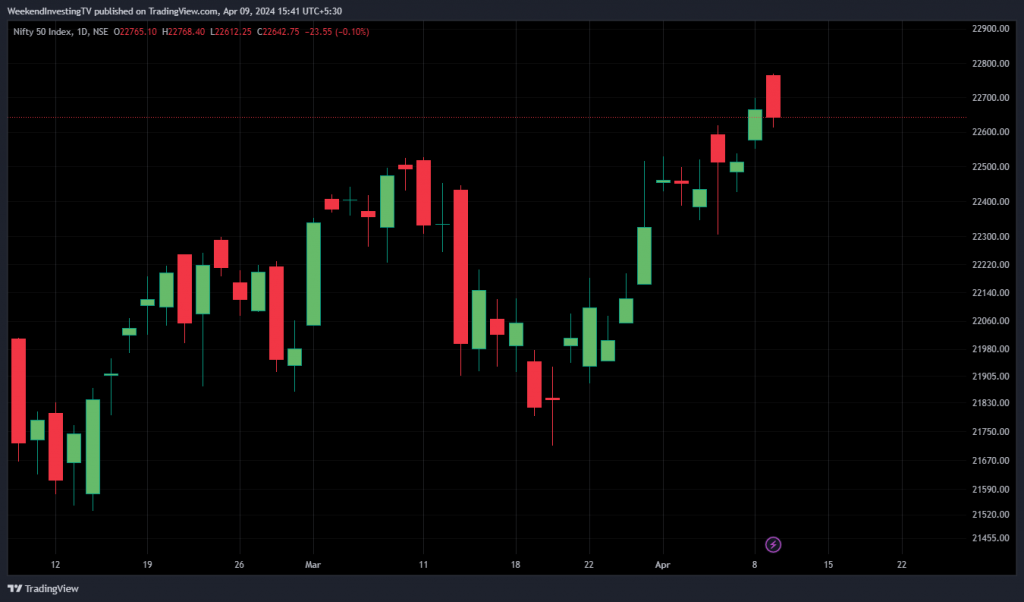
The Nifty index began the day with a promising gap up, reaching a new high beyond 22,750. However, the enthusiasm waned as the day progressed, with the market surrendering its initial gains to close slightly below the previous day’s level. This retreat suggests a moment of consolidation or pause, possibly due to the market digesting the rapid 1,000-point ascent in recent weeks.
Nifty Heatmap
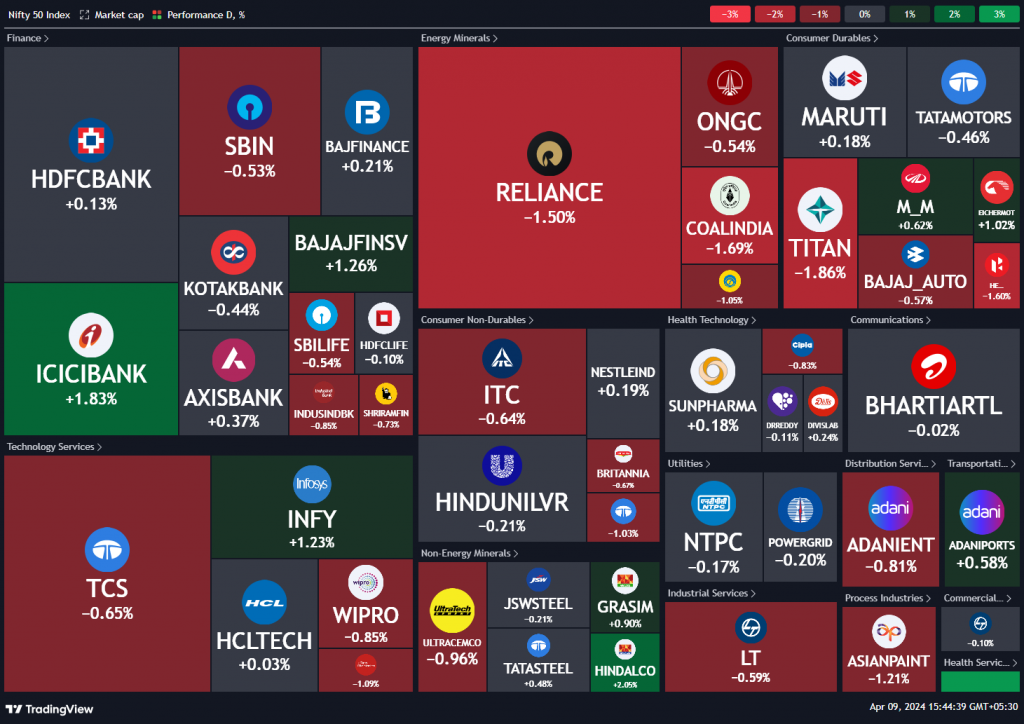
The market’s mood was somewhat mixed, with more green in the large caps compared to the mid-segment of the market. Notably, Reliance experienced a significant drop of 1.5%, while the energy sector also faced downturns. On a positive note, ICICI Bank saw a significant uptick of 1.8%, likely fueled by news of its tie-up with Policy Bazaar.
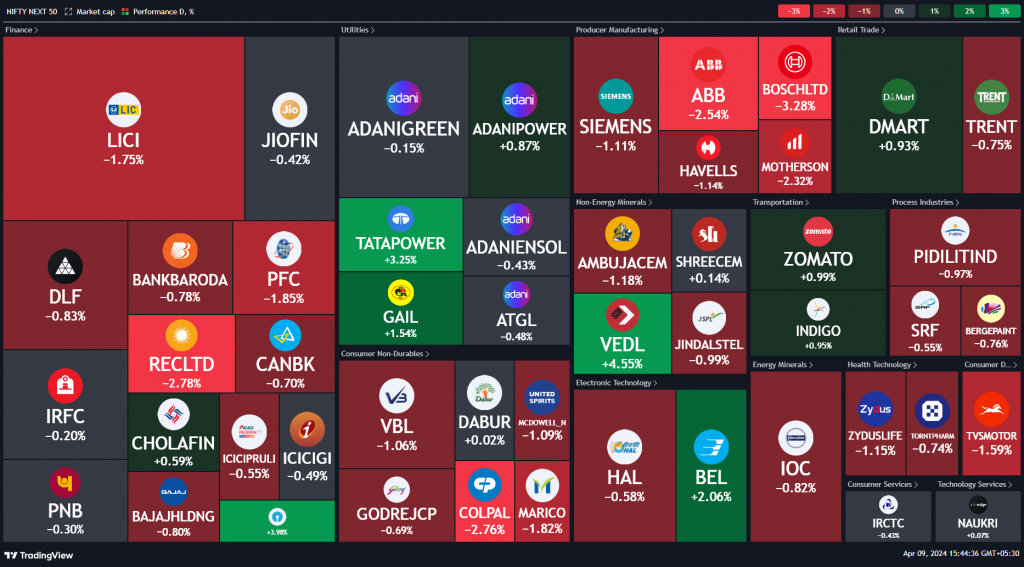
Conversely, the Nifty Next 50 heat map revealed a less optimistic picture, with commodities and utilities being the rare pockets of green amidst widespread reds. This suggests a selective approach by investors, focusing on specific sectors while remaining cautious overall.
Sectoral Overview
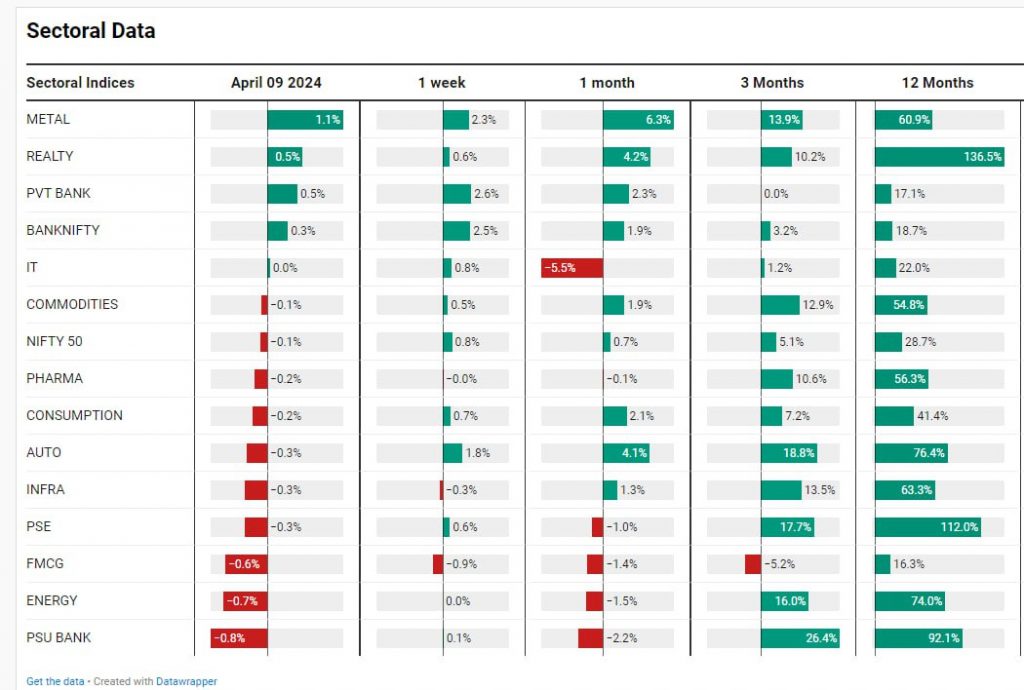
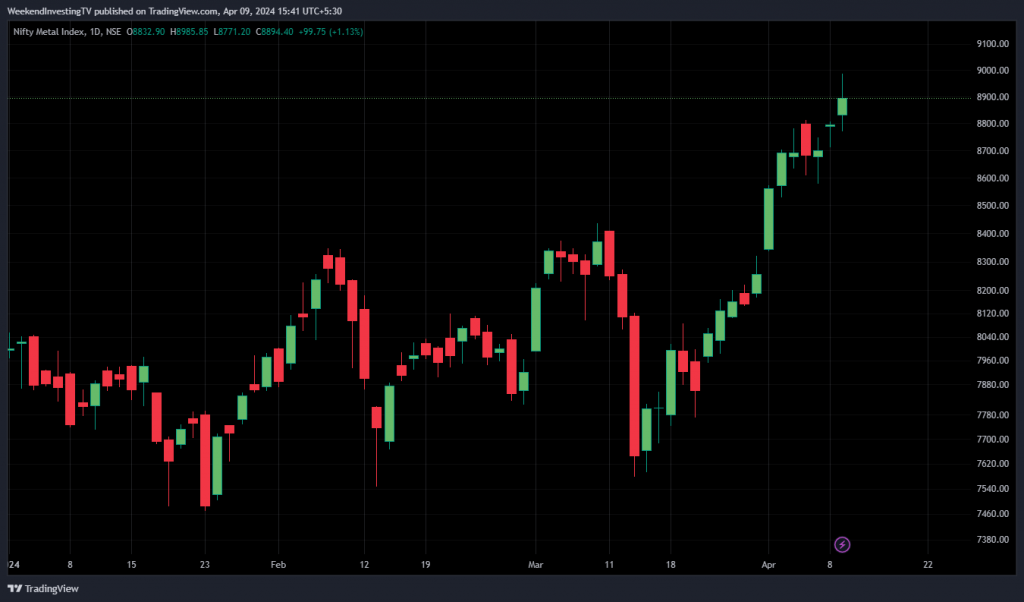
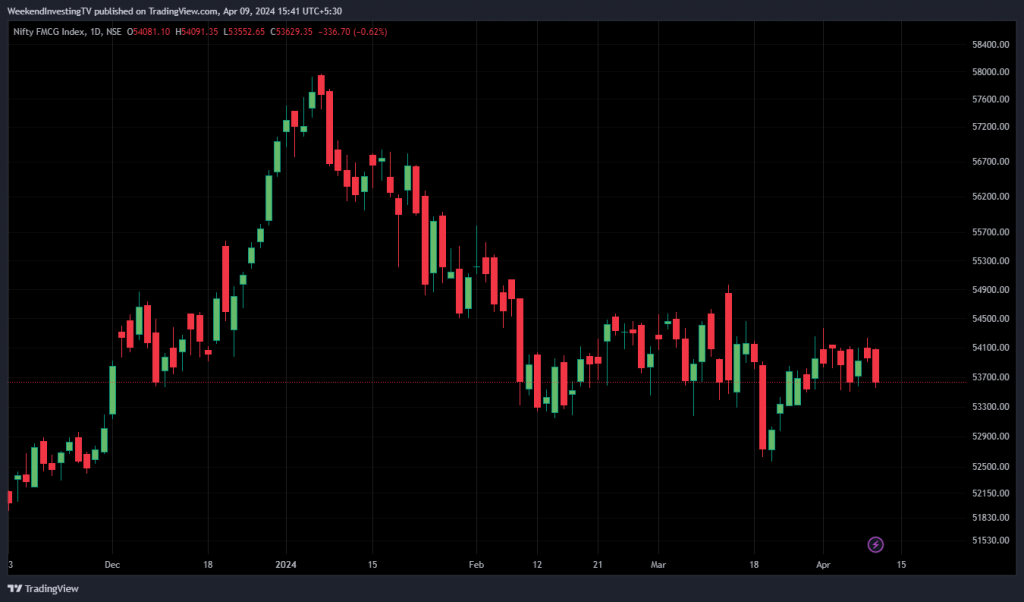
Metals emerged as a standout sector, registering a 1.1% increase. Real estate continued its impressive rally, undeterred by any potential market slowdown. However, PSU banks and the energy sector lagged, reflecting broader market sentiments. The FMCG sector, in particular, has been a point of concern, failing to show significant movement and hinting at potential underlying issues.
Mid & Small Cap Performance
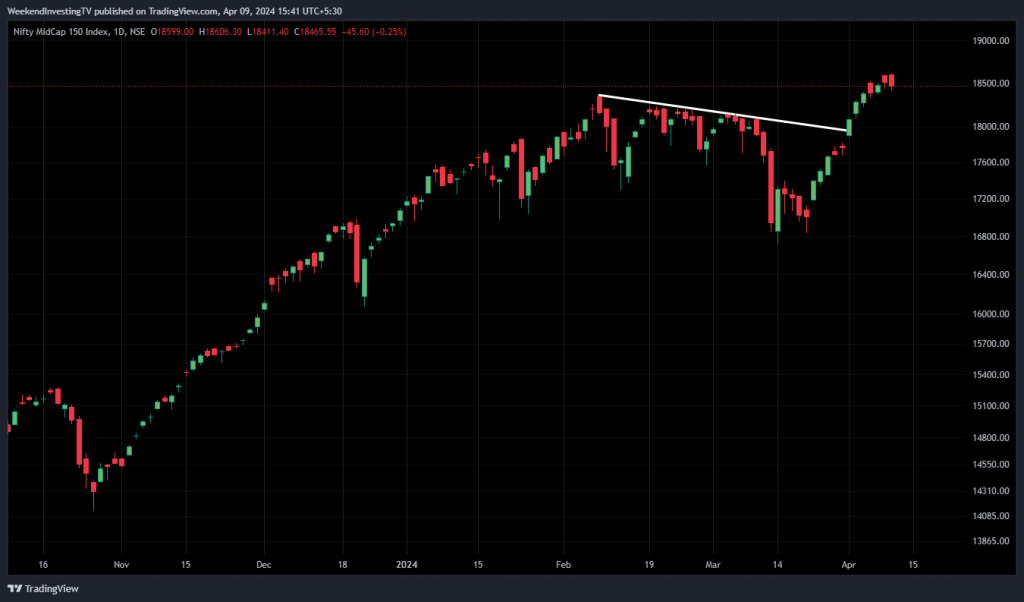
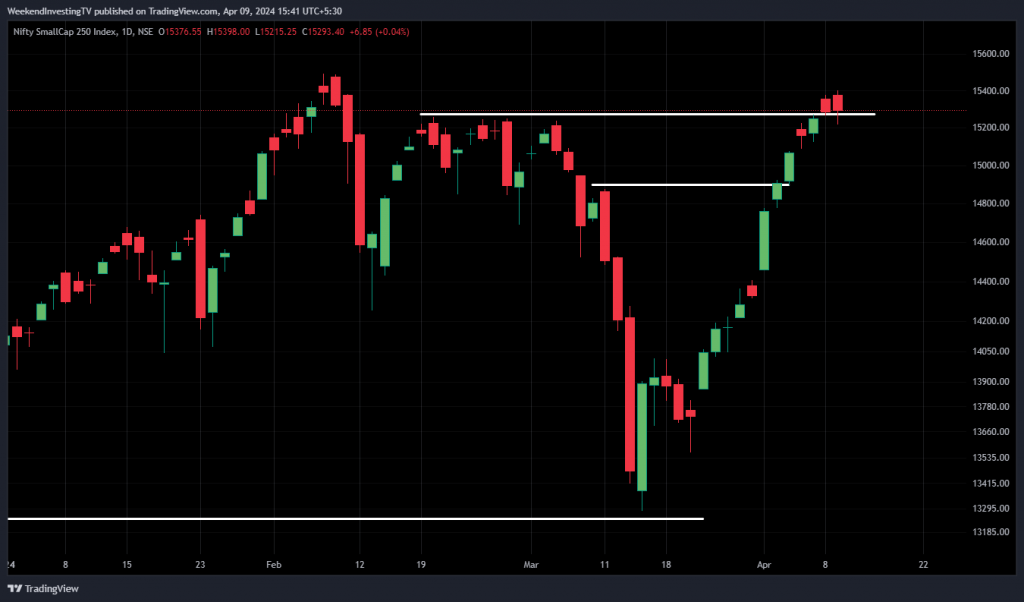
Mid caps are simply undergoing a phase of consolidation. Despite opening higher than the previous day, they closed slightly lower, indicating only minor, inconsequential movements. Similarly, small caps started the day on a positive note but ended almost unchanged from the day before. Given the significant 2000-point rally they’ve experienced, a slight pullback would be expected. However, any correction has been mild, suggesting underlying strength remains intact.
Nifty Bank Overview
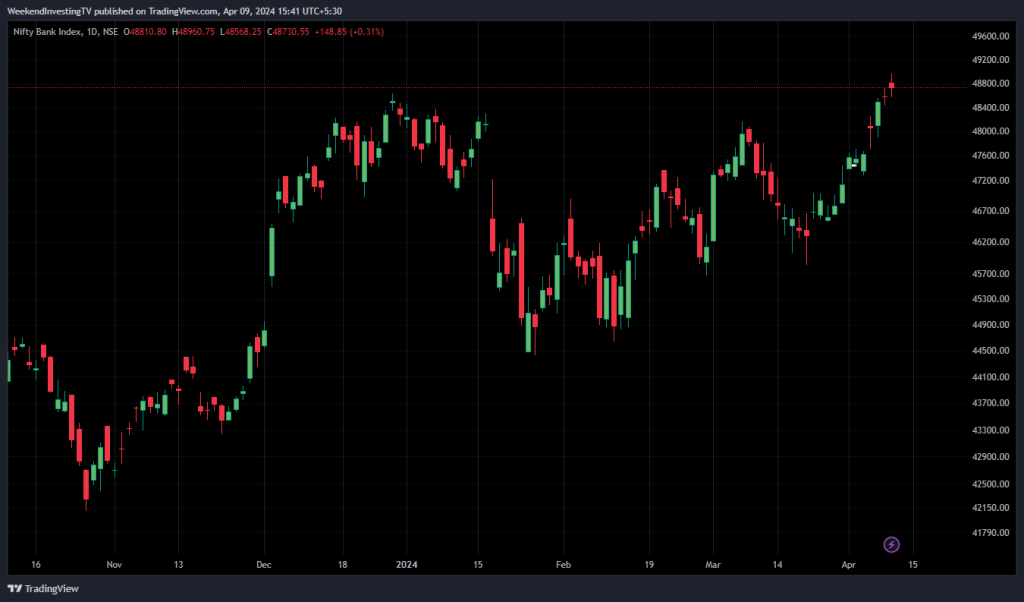
The banking index has seen an upward trend, relinquishing some gains during the day but ultimately closing at a new high. This positive performance of the banking index bodes well for the market. The sustained success of the banking sector suggests a potential uplift for the broader Nifty index as well.
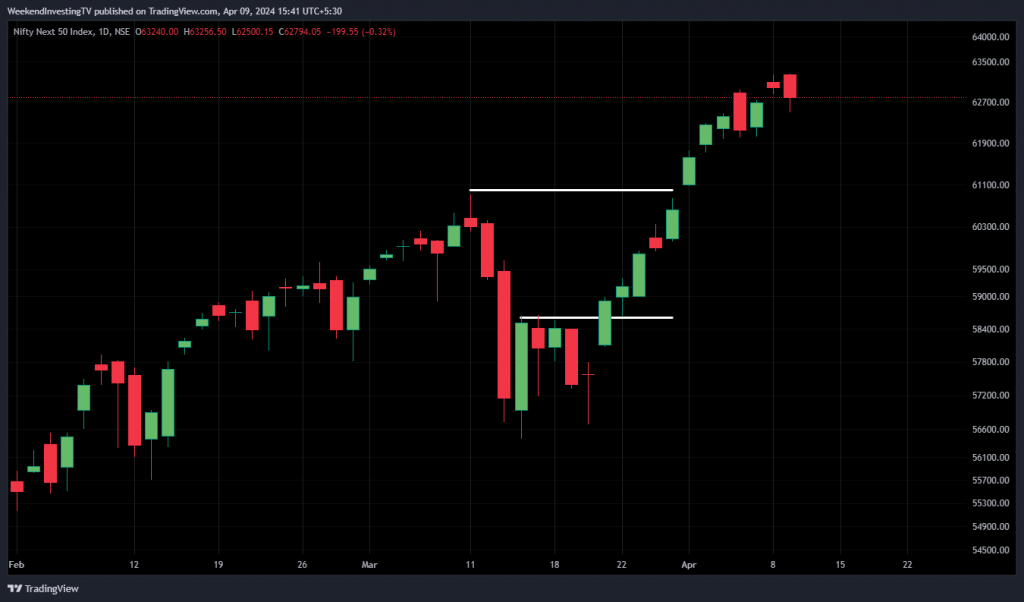
Nifty Next 50
Next 50 also filled this gap right here and closed just below yesterday’s close. So again, you know, the, the current leg is stretched, so it needs some, some consolidation some correction before the next one comes in. And I think, and this is just my speculation, that one big move before the election outcome should be there.
Nifty Metal
You can see the market is just about crossing its previous high, but metal index is much higher than previous ISO.
Nifty FMCG
Since February, FMCG has just gone dead, and it looks like, you know, it wants to go lower. So until we clear out this 55,000 mark, FMCG remains a sort of cult sector to be at Metals index, extremely robust, flying much ahead of the market.
GOLD/ INR
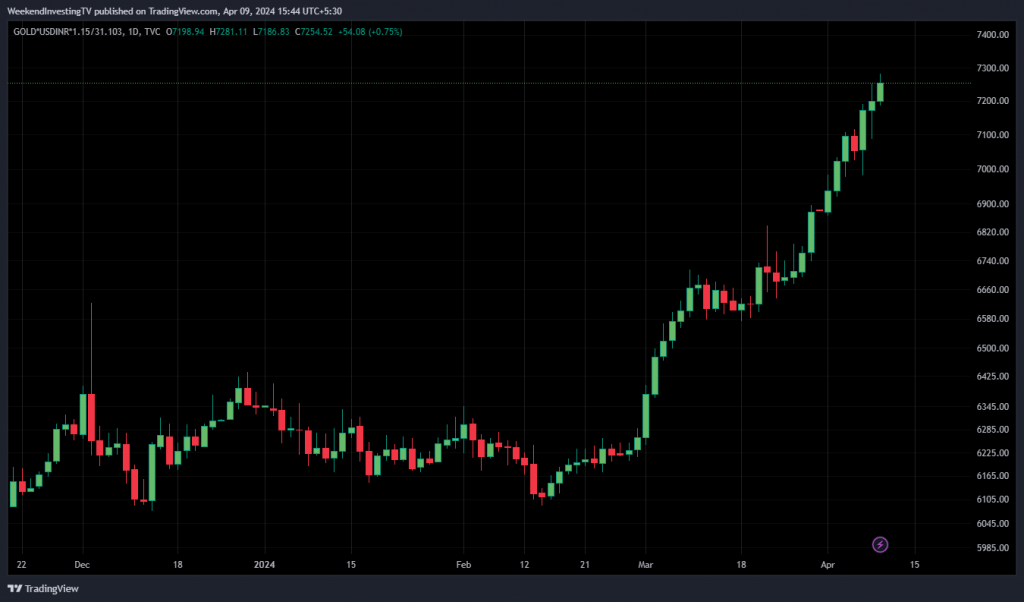
Gold has gone from virtually 61,000 per 10 grams, or 6100, you can say, per gram, and we are now at 72 50. So lot of traders in the bullion market, they call it Sarafa bazaar, would be crushed because they were, would have become very confident after Iran here that it’s going to come back. Possibly this covering demand, the short covering demand, along with a lot of central banking demand, is just fueling this. And this is not even ETF demand right now. I’ve shown several charts that ETF’s are not picking up too much of aum yet. Jewelry demand, of course, would have collapsed by now because people will now wait and watch.
So this is something very unique and unusual that is happening. Maybe this is a sign or a precursor of something bad that’s going to happen in the world. Gold usually doesn’t move this way, but it is doing exactly what it is supposed to do. It is creating a hedge in every portfolio that it is held so that if everything else starts to fall off, this is already in place in terms of gains.
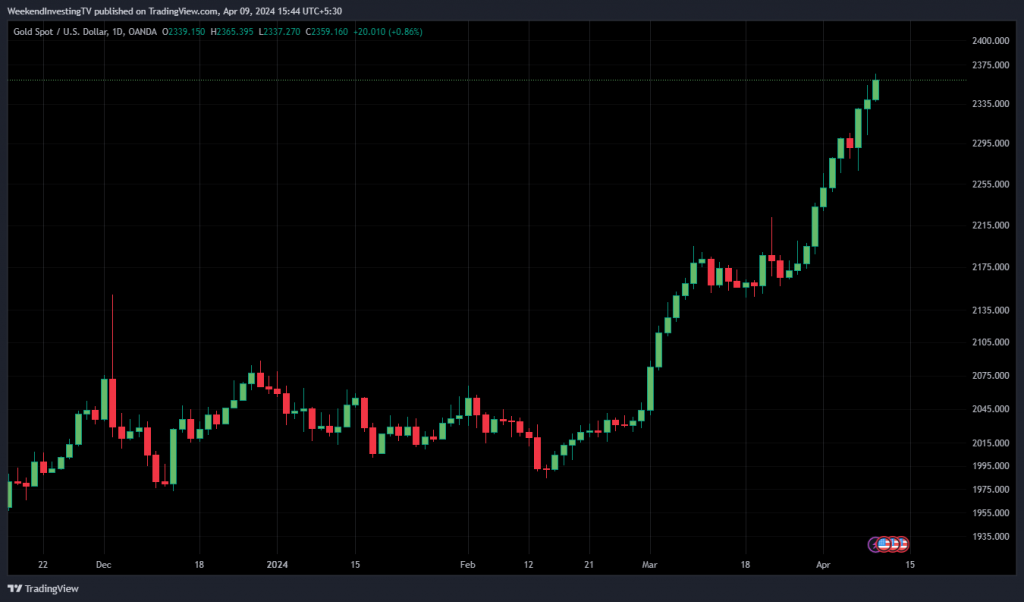
XAU/ USD
This is the dollar chart, again, very similar to the rupee chart again, you know, amazing run from 1990 or till 23 60. Now, singular run in just a matter of less than two months.

Disclaimers and disclosures : https://tinyurl.com/2763eyaz

