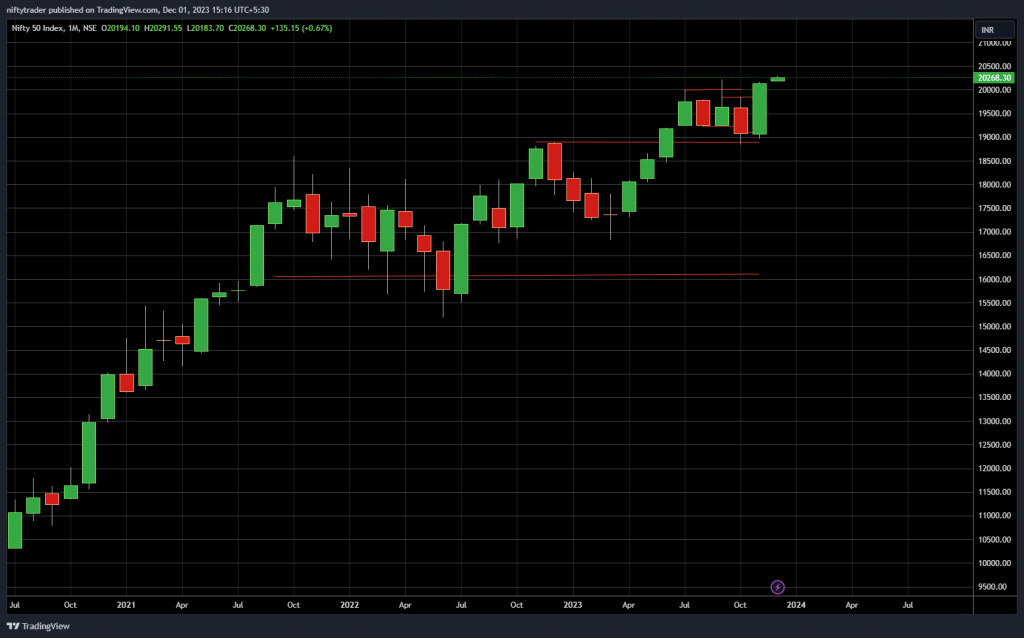
In this article, we will analyze the Nifty monthly chart for November and discuss what it signifies for future market movements. Let’s dive in!
The month of November 2023 opened at 19,064 and closed at 20,133, indicating a gain of approximately 1100 points. Such a substantial gain in a single month is a rarity in the market. Looking back over the past few years, there have only been a few instances of a thousand-point move in a month.

While it’s important to acknowledge that there are no guarantees in the market, historical data suggests that when the market experiences a monthly close at an all-time high, there is a good chance of further upward movement. I’d like to point out that on previous occasions when the market witnessed such a milestone, it continued with its upward trajectory.
However, it’s worth mentioning that after reaching an all-time high, the market does encounter some sideway movements or occasional downward months. But these are usually followed by significant upward moves.
The notable move in November indicates that there is more to come and the market is likely to continue its upward trend.
Traders and investors should not adopt a shorting perspective or assume that the market has already run up. Such a mindset can potentially deprive individuals of great opportunities. Instead, this is a time to be opportunistic and look for trades on the long side.
Discretionary traders and investors, especially, should capitalize on such times. While momentum investors can remain neutral and let their systems take care of the trades, those who try to time the market or focus on specific periods can benefit from this particular phase.
During the one-and-a-half-year consolidation period between Sep 2021 and Apr 2023, the market moved only 10%. Such consolidation periods often precede strong market movements. The recent gain suggests that the market is finally breaking out of this consolidation phase, and there is room for further growth.
Valuations have also come off from their highs. Although they are not the sole factor for determining market movements, the current valuations suggest that there is room for more gains. With the current valuation at 20.5 times, compared to 24 in the past, there is potential for the market to reach 24,000 -25,000 levels if valuations were to revert to their previous levels.

If you have any questions, please write to support@weekendinvesting.com


