As an investor, it is crucial to have a clear understanding of price patterns and trends in the market. One such pattern that has recently emerged in the Indian gold market is the occurrence of monthly all-time highs. In this article, we will delve into the significance of these highs and analyse their implications for future price movements.
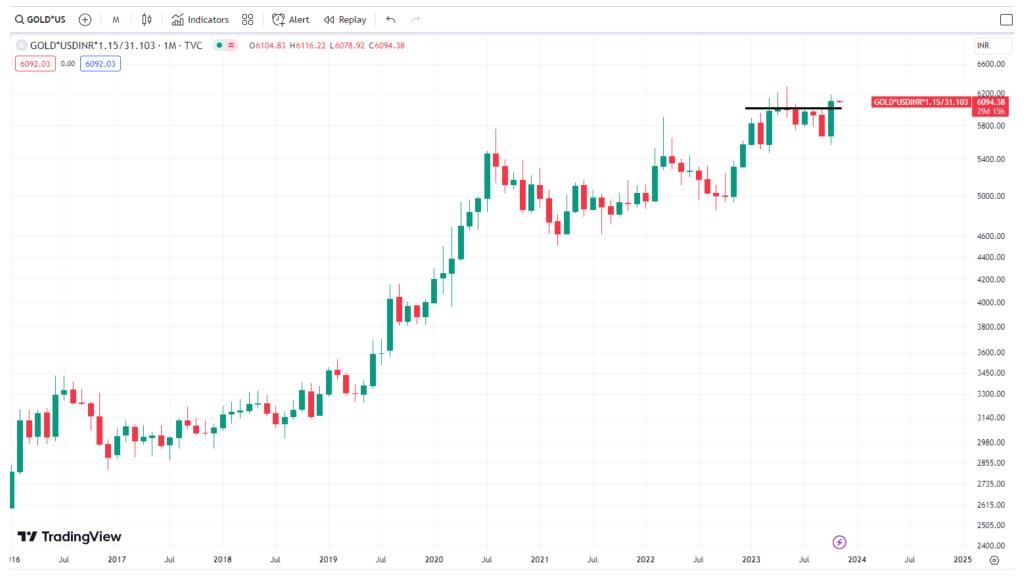
To plot this chart, the gold symbol on TradingView, TVC gold, is multiplied by USDINR (the USD to INR exchange rate) and then multiplied by 15% to consider the import duties. Additionally, to convert the price of gold from troy ounces to grams, the equation is divided by 31.103, which is the conversion rate from troy ounces to grams. This calculation provides the theoretical landed price of gold in Indian Rupee terms, inclusive of duties.
Calculation : TVC:GOLDFX_IDC:USDINR1.15/31.103 < copy paste this on trading view >
In October 2023, INR GOLD experienced a monthly high level of prices, setting a new record. This means that the closing value of gold in Indian Rupee terms reached an unprecedented level. Prior to this, the highest monthly close was in April, followed by a corrective phase.

However, with this recent breakout and new high, a historical analysis of previous monthly all-time highs could provide valuable insights into future price movements.
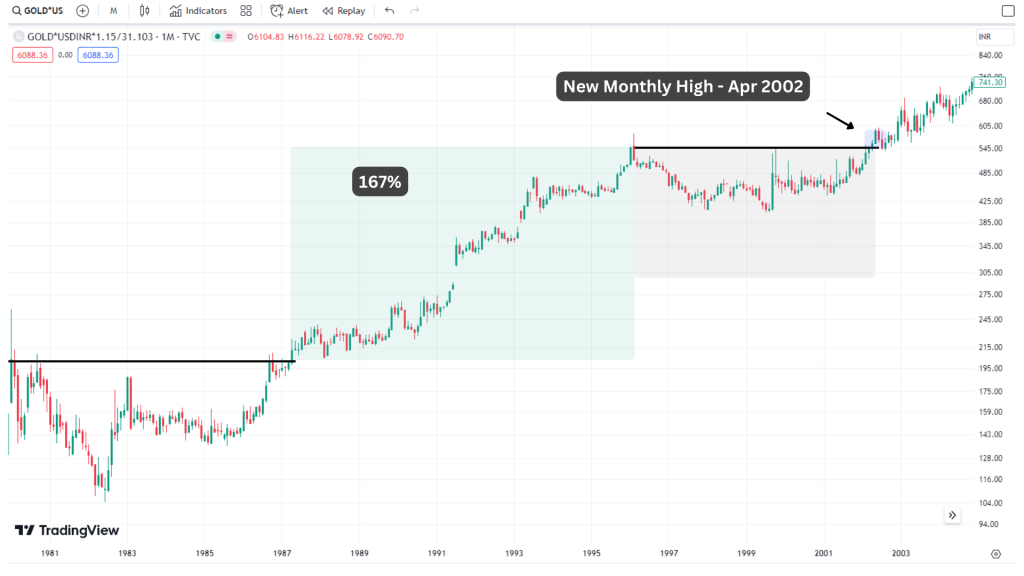
Let us go through the journey of INR GOLD through the past few decades to examine the occurrence and impact of monthly all-time highs. In 1979, the price of gold reached Rs201 per gram, marking a significant rally from around Rs40 per gram. This rally resulted in a fivefold increase in prices. After a lengthy time correction phase, a retest of the breakout occurred in April 1987, launching another strong rally that lasted almost a decade until January 1996. During this period, the price of gold surged from approximately Rs145 to Rs550 per gram, representing a three-and-a-half-fold increase.

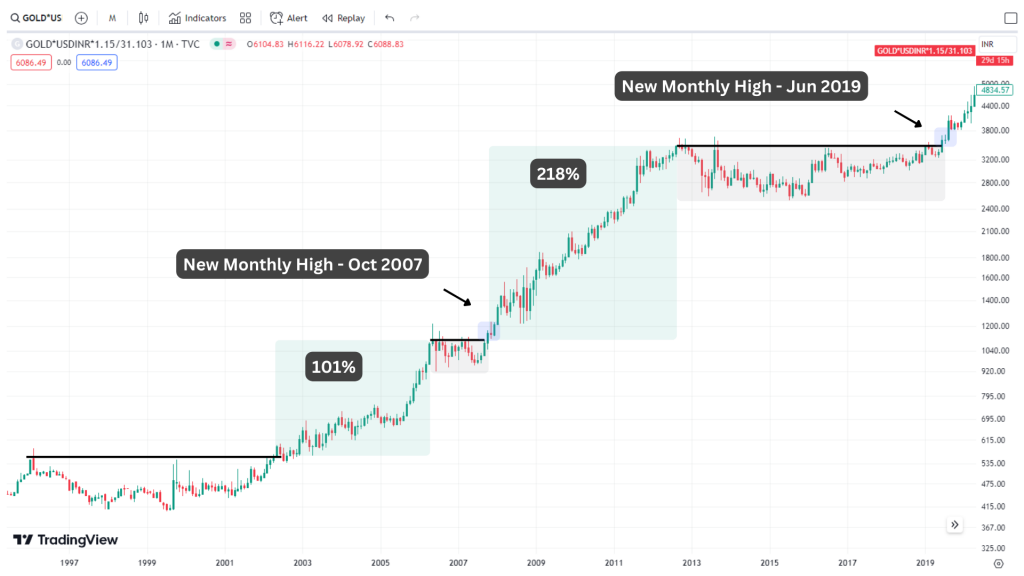
After a period of consolidation, the market broke through another all-time high in 2002. Over the next four years, the price of gold nearly doubled from Rs556 to Rs1100 per gram.

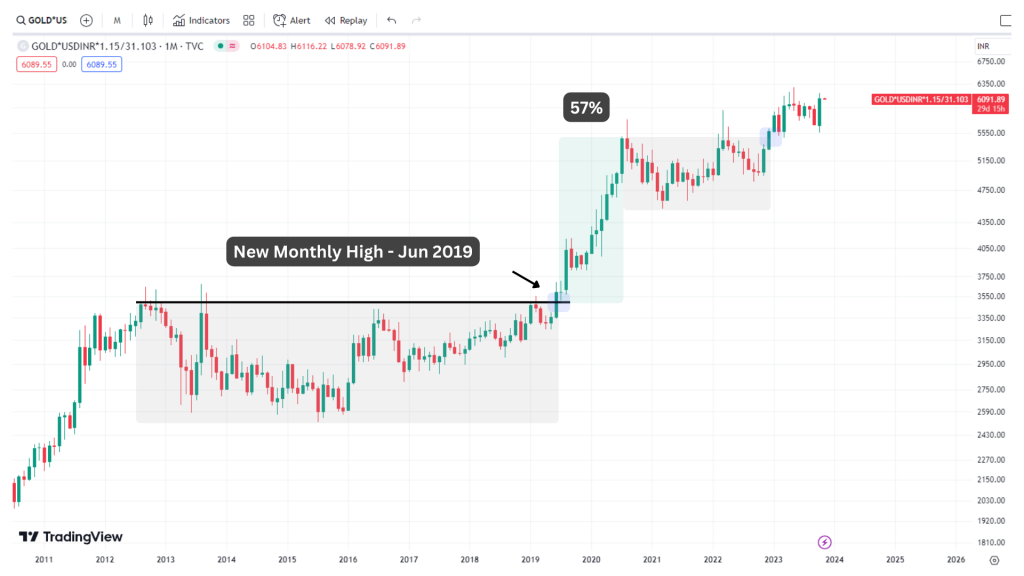
A subsequent correction phase followed until October 2007 when the market once again broke out and went on to achieve a three-and-a-half-fold increase, reaching Rs3400 per gram by August 2012. Another correction ensued, leading to a breakout in June 2019 at Rs3600 per gram. Within a year, the price surged to a high of Rs5400 per gram, resulting in a substantial 60% gain.

Following this analysis, INR GOLD has been in a time correction phase since July 2020 until December 2022, indicating that it has taken two and a half years for the market to retest the previous breakout. However, with the recent breakout at Rs5500 per gram, there has already been a 10-12% increase in prices.

Based on this historical analysis, we can conclude that monthly all-time highs in the Indian gold market are significant indicators of future price movements. The point we are trying to drive home is that these highs should not be disregarded, as they suggest further upside potential. While the current gold price of around Rs 60,000 to Rs61,000 per 10 grams may seem substantial, future prices could reach levels as high as Rs 70,000, Rs80,000, or even Rs90,000 per 10 grams.
It is important to note that these projections are based on historical price patterns and trends. As with any investment, it is crucial to conduct thorough research, consider various factors influencing the market, and consult with financial advisors before making any investment decisions.

If you have any questions, please write to support@weekendinvesting.com


