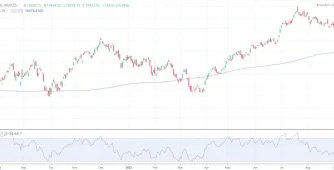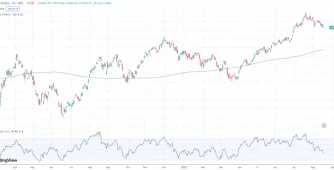
- Compounding can actually change your LIFE . .
- The Pain of HUGE DRAWDOWNS
- Handing Volatility at Stock Level is even more difficult
- Introducing Mi India Top 10
- Let us dive into some performance metrics
- CAGR Progression | Mi India Top 10 (v) Nifty 50
- Rolling Returns Comparison
- Rolling CAGR Comparison
- 3 Yr Rolling CAGR | Mi India Top 10 (v) Nifty 50
- SIP Comparison
- To Summarize – –
Compounding can actually change your LIFE . .
Humans are wired to think linearly when it comes to compounding. It has by far been a very difficult to comprehend the kind of MAGIC one can witness upon embracing and adopting the concept of compounding when it comes to both daily habits / processes as well as money.
let us see some scenarios to drive this concept deeper.
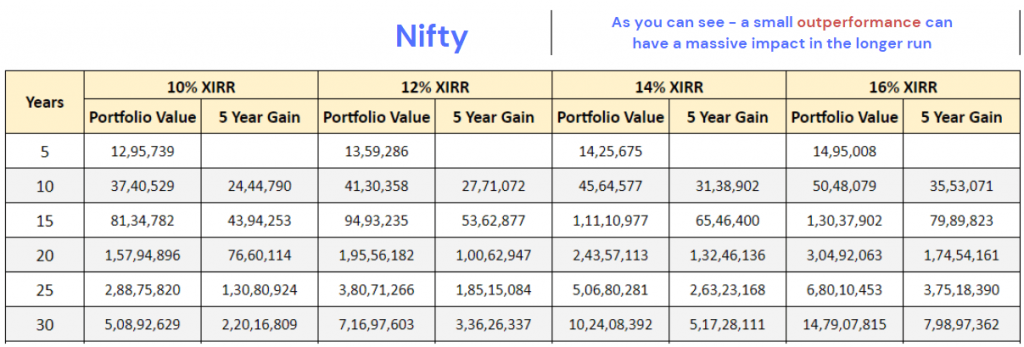
We have considered a Rs 15,000 monthly SIP with a 5% Y-o-Y increase in value of SIP in all of the illustrations. What we try to understand is the impact of compounding as time progresses for various % of XIRR.

From the image above – we can notice a marginal increase of 40% in the portfolio value at year 30 as we go from 10% XIRR to 12% XIRR. Not so significant, right ? 12% is what Nifty has historically managed and is also what you can potentially expect if you are invested in a Nifty 50 mirrored portfolio.
Let’s increase the XIRR a bit more and see how things stack up.
What if we could invest in a portfolio that can do better than India’s flagship index – the Nifty 50.
If you can achieve 14% XIRR, your portfolio’s current value doubles up at year 30 compare to 10% XIRR & if at all you can manage 16% XIRR, your portfolio’s current value triples. So the concept we are trying to help you understand is the deadly combination of time and a reasonably achievable rate of return for your portfolio. Having a reasonable expectation on the rate of returns is crucial as you increase the chances of risk as well in the process of trying to achieve more returns. So an optimal balance is the key to a peaceful investing journey.
Let’s spice this table up a bit more by adding another 5 years.
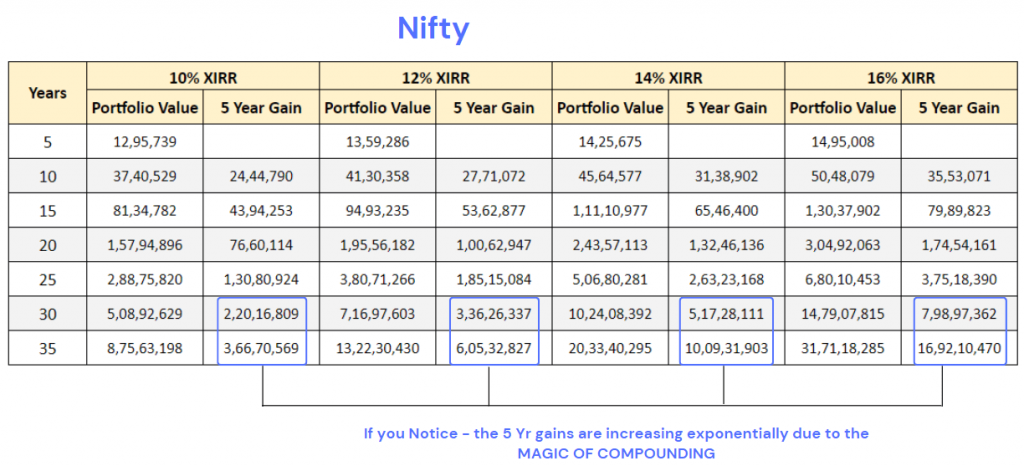
Did you see what this combination could do to your overall portfolio ? By now, we hope we were able to understand that
- Time can do wonders to your portfolio.
- It would be icing on the cake if you can manage to beat Nifty’s performance too to give you that additional boost.
Is there a way to outperform Nifty 50 ? People usually try to do index investing or attempt at picking stocks directly which comes with it’s own set of challenges which we will cover below.
The Pain of HUGE DRAWDOWNS
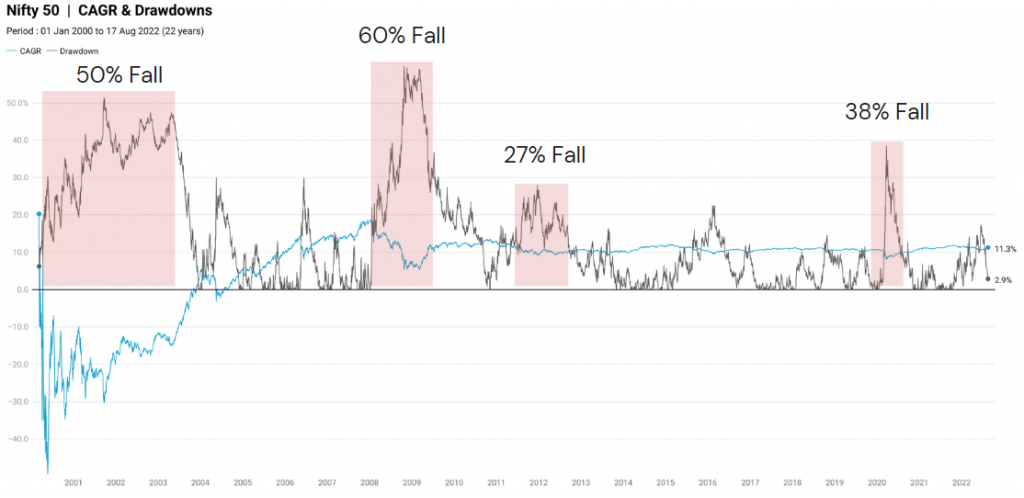
In the last 20 odd years, we can notice several instances of Nifty giving a lot of pain to it’s investors. This volatility may seem okay to digest at a glance but trust me it is rather easier said than done. These kind of massive falls makes us
- lose faith in the markets
- stop our SIPs
- go try time the market
- lose your confidence &
- more importantly create a lot of distress.
Handing Volatility at Stock Level is even more difficult
Drawdowns – Between 01 Jan & 31 Mar 2020 <COVID Crash>

There is another phenomenon that is widely misunderstood in the markets – “Top Stocks are stable”
The above chart depicts the drop in stocks between 01 Jan 2020 and 31 Mar 2020 (covid). You see how big names like INDUSIND BANK, BAJAJ FINANCE, AXIS BANK, HINDALCO, MAHINDRA ONGC , JSW STEEL underperformed the benchmark (38% fall) & fell by more than 50%. So popular names can also fall hard and one has to be prepared for such moments when markets go weak.
You may wonder – what if there was a way to identify the strength and stick to it at all times so that your portfolio remains calm during market falls and tries to outperform when markets trend on the upside.
Introducing Mi India Top 10
Mi India Top 10 is a dynamic strategy which aims to outperform the underlying benchmark Nifty50. This product is suitable for use in all stages of the market cycles as its design is to remain invested in the strongest 10 stocks in the pack regardless of market conditions.
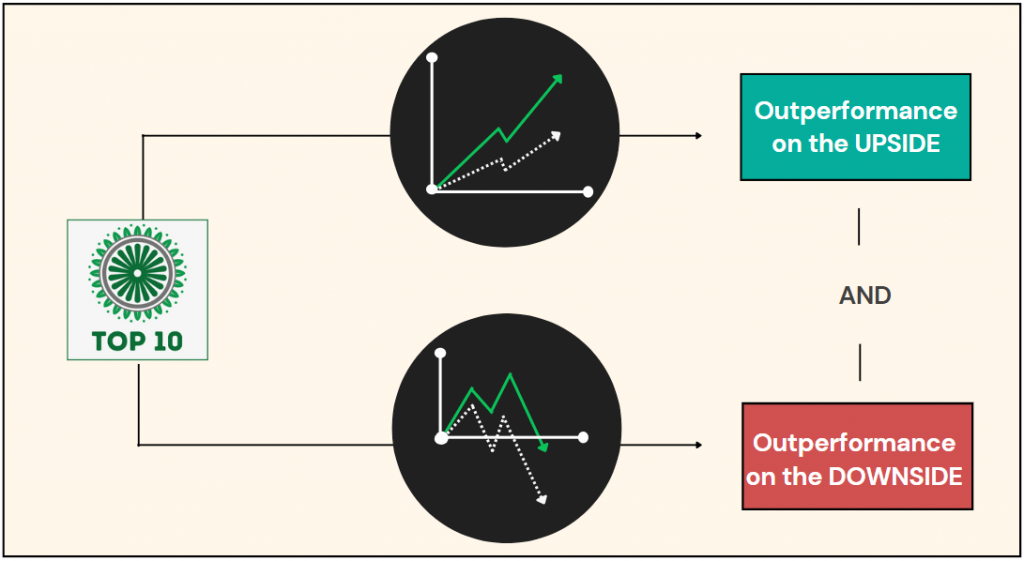
Mi India Top 10 , like any other WeekendInvesting strategy is designed to outperform the benchmark on the upside and also on the down side.
What we mean is – When there is an up trend, the strategy tries to outperform it’s benchmark by riding on the strongest 10 stocks from it’s universe. And when the markets are weak, the strategy hopes to fall lesser than the benchmark using the same principal of sticking to the strongest stocks thus extracting relative outperformance at all times.
Let us dive into some performance metrics
Mi India Top10 (v) Nifty 50
Period : 01 Apr 2016 to 16 Aug 2022
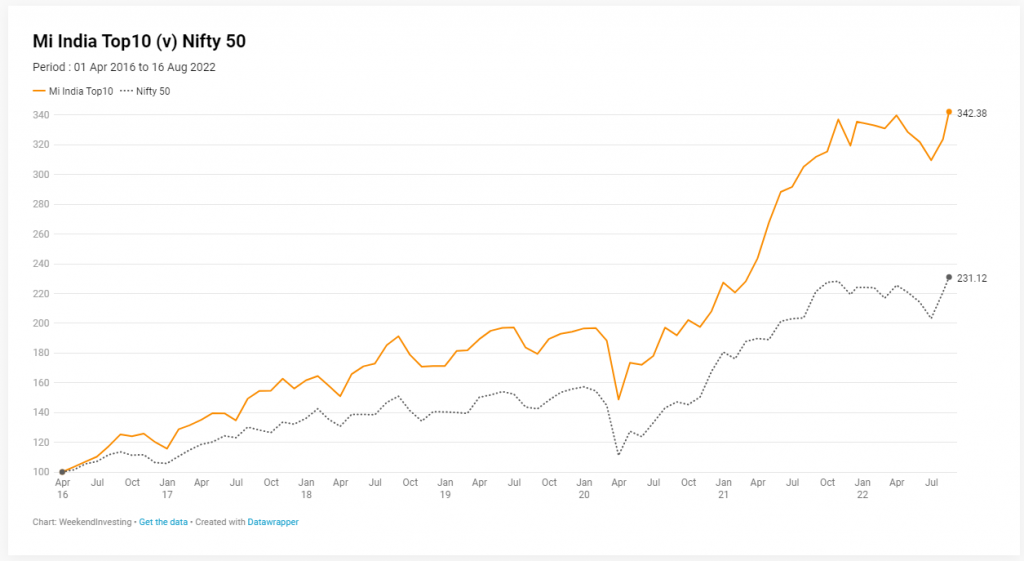
Rs 100 invested in Mi India Top would have yielded 242% gains between 01 Apr 2016 & 16 Aug 2022 compared to 131% on the Nifty 50 index. There wasn’t an instance of underperformance throughout the entire period.
https://datawrapper.dwcdn.net/PMZ68/1/
You can see the benefit of outperformance on both upside & downside from these metrics where Mi India Top 10 clocked almost 2x the absolute returns of it’s benchmark with a delightful CAGR of 21.3% compared to 14% on Nifty 50
The beauty is that the strategy has a better CAGR while managing to have lower drawdowns which in turn gives a superior RoMaD ratio of 0.87 compared to Nifty 50’s 0.36.
CAGR Progression | Mi India Top 10 (v) Nifty 50
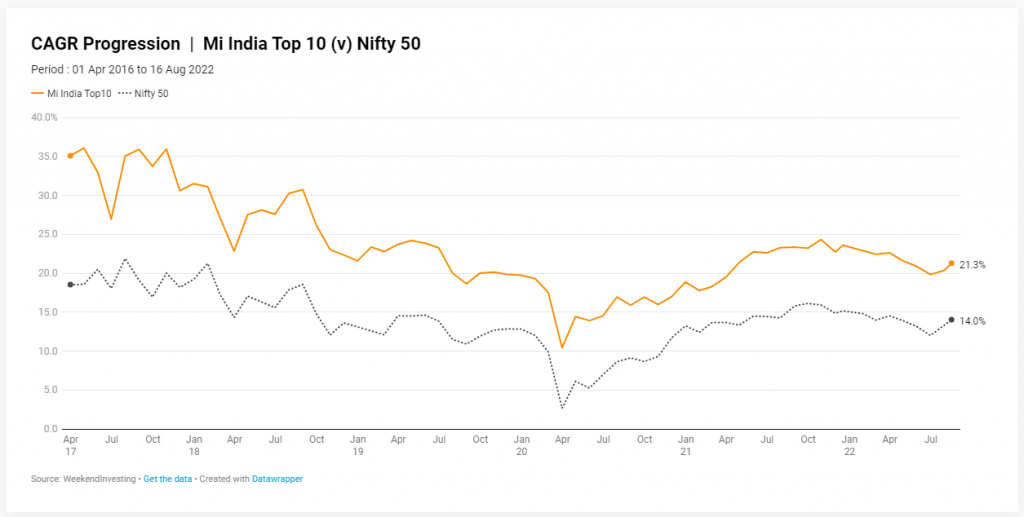
Right at the bottom of COVID fall, Mi India Top 10’s CAGR (from 01 Apr 2016 (or) 4 year CAGR) was 10% plus which in itself is a huge testimony to the impact created by holding on to the winners for long and discarding losers early. Top 10 has outperformed the benchmark comfortably in the entire period as you can see from the above chart.
Rolling Returns Comparison
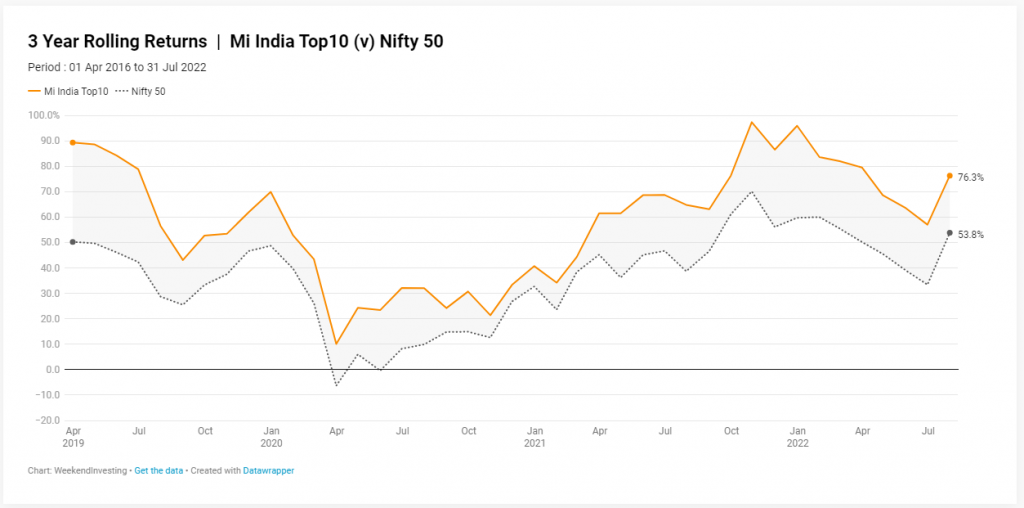
3 Year Rolling Returns | Mi India Top10 (v) Nifty 50
4 Year Rolling Returns | Mi NNF 10 (v) Nifty Next 50
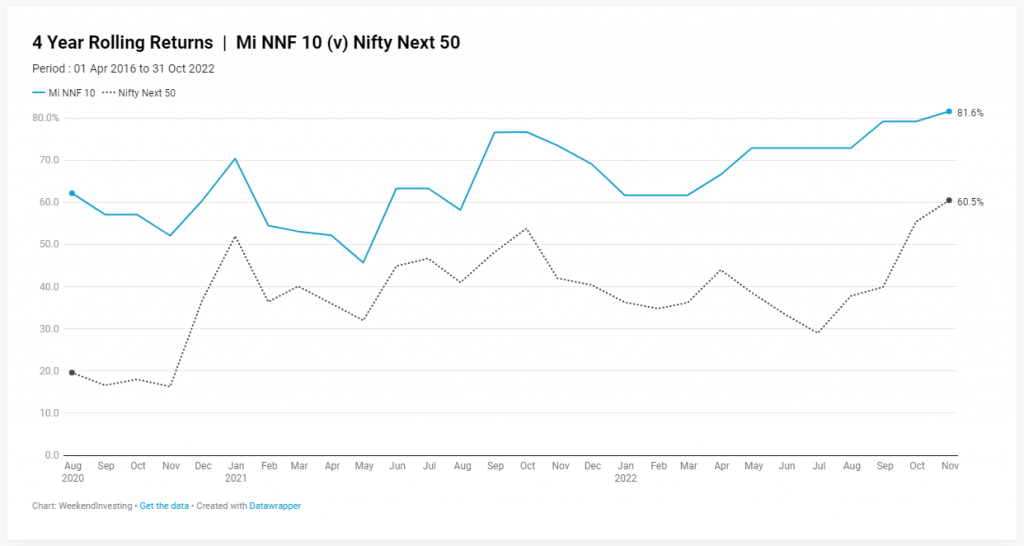
The above two charts indicate that there wasn’t a single phase where Mi India Top 10 underperformed the index. Such is the power of Momentum which is extremely good at identifying trending stocks early and riding them for long periods till momentum fades out.
If you are new to rolling returns , you can check out a quick explainer below,
https://www.smallcase.com/blog/calculating-rolling-returns/
Rolling CAGR Comparison
Period : 01 Apr 2016 to 31 Jul 2022
3 Yr Rolling CAGR | Mi India Top 10 (v) Nifty 50
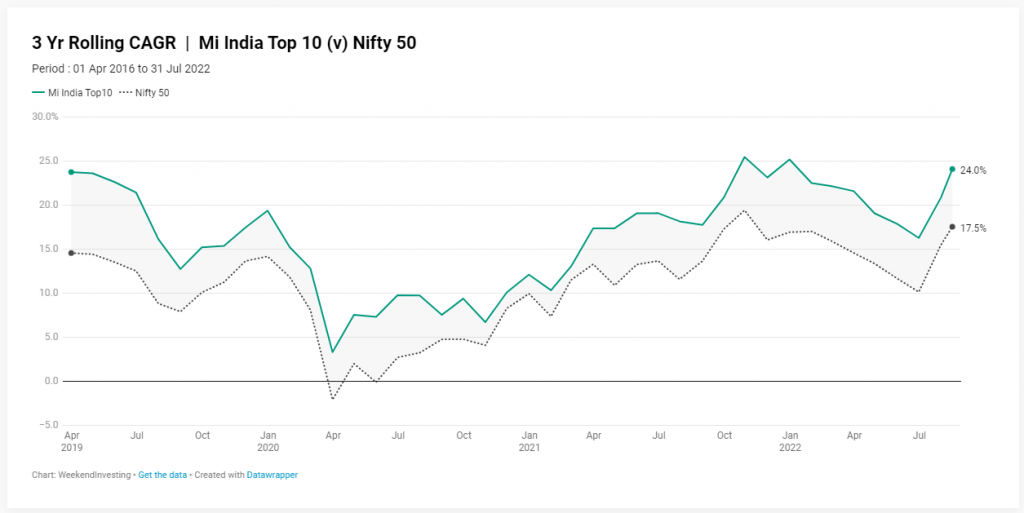
Mi India Top 10’s three year CAGR stayed in the positive territory at any given point in time while Nifty 50’s CAGR dipped into the negative zone during COVID crash.
SIP Comparison
SIP Comparison | Mi India Top 10 (v) Nifty 50
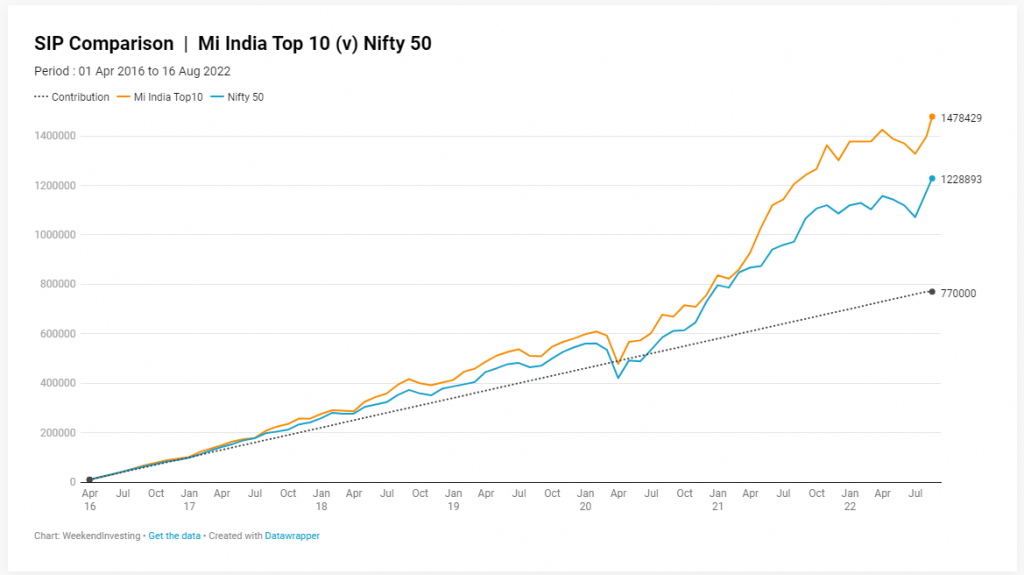
A monthly SIP of Rs 10,000 on Mi India Top 10 – starting from Apr 2016 till Aug 2022 would have yielded a fantastic XIRR of 20.3% compared to 14.5% on Nifty 50.
To Summarize – –
Mi India Top 10 can be a fantastic core portfolio that can help you immensely in your compounding journey.
- Always sticks to top 10 trending stocks from it’s universe – Nifty 50.
- Superior CAGR compared to it’s benchmark.
- Significantly Lower Drawdowns compared to it’s benchmark to keep you calm during weak market conditions
Come in with a mindset to stay for as long as possible (pre - ferably 4+ years) and have a phenomenal journey !
Hope to see you in WeekendInvesting Family soon.
If you have any questions, please send an email to support@weeekendinvesting.com and we’ll get back in a jiffy.


