Exploring Gold Seasonality: Insights from 30 Years of Data
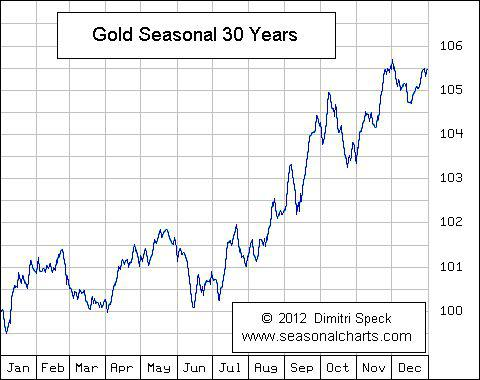
Intriguing insights emerge from a comprehensive analysis of gold seasonality, as depicted in the chart from seasonalcharts.com. This chart encapsulates the trends observed in gold prices over the past three decades, offering valuable insights into the cyclical nature of this precious metal’s movement.

The chart reveals distinctive patterns in gold prices across different months of the year. Notably, the first two months typically witness a rise in gold prices, followed by a decline in March and April. However, a resurgence occurs in May, extending into the early part of June. Subsequently, from May to the beginning of July, prices tend to trend downwards.
Anticipating Market Movements
As we approach the latter half of the year, spanning from July to December, a significant upward trajectory is observed in gold prices. This period coincides with various factors such as the festive season and increased demand for jewelry, particularly in regions like India. Additionally, the onset of the Chinese New Year towards the end of the year further stimulates buying activity, contributing to a surge in gold prices.
These seasonal patterns offer valuable insights for investors seeking to navigate the gold market. While historical trends provide a probabilistic framework for anticipating market movements, it’s important to note that past performance does not guarantee future outcomes. Nonetheless, understanding the ebb and flow of gold prices throughout the year can inform investment strategies and decision-making.
Looking ahead, there is optimism surrounding the prospects for gold in the second half of the year. Despite the substantial increase witnessed in gold prices thus far, there is anticipation for further growth, especially as we transition into the traditionally buoyant period for gold demand.
Spotlight : The Casino Math behind Mi NNF 10
In today’s rapidly evolving world where the rate of emergence of new market leaders is at an all time high, having an agile strategy at work becomes an absolute must.
You might be good at identifying a good stock or a sector but what if it doesn’t turn out well ? What if another stock or a sector starts performing relatively better ?
Is your strategy agile enough to dump the sluggish stocks and identify new leaders ?
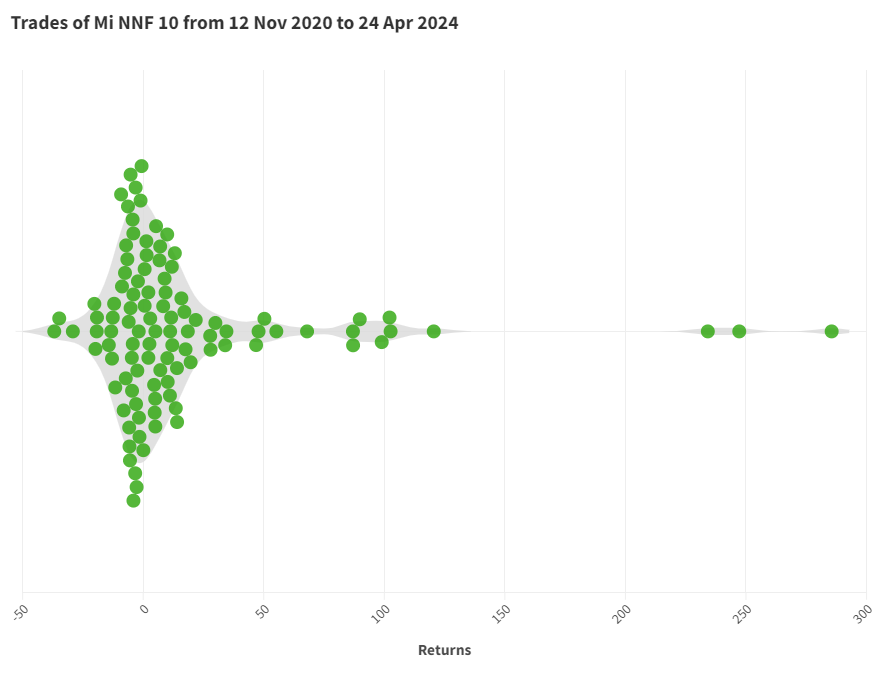
Below is a chart depicting the performance of all the trades that Mi NNF 10 has taken since going live on 12 Nov 2020 (till 24 Apr 2024)

Some of momentum investing’s core principles that can be evidently validated from this chart are ;
– Winners are allowed to run far while losers are discarded early. The biggest winner has clocked 285% while the biggest loser has returned (-37%).
– 44% of the trades are loss making while 56% are winners.
– 76% of the trades fall in this crowded zone of -20% to +20% but the stat that makes the strategy successful is that the average winner returns a healthy +39% while the average loser returns only -9%.
– This is the casino math that has enabled the strategy to outperform its benchmark by a very healthy margin.

Disclaimers and disclosures : https://tinyurl.com/2763eyaz
If you have any questions, please write to support@weekendinvesting.com


