
This truncated week was exciting on the Indices but somehow it did not translate fully onto the Mi50. Nevertheless, Mi50 closed the week at +47.73% for the FY (I am hearing the FY will be Jan to Dec soon :). Several re-attempts were made at coming close to the 50% mark this week, but it did not succeed. Nevertheless the trend on the chart remains up.
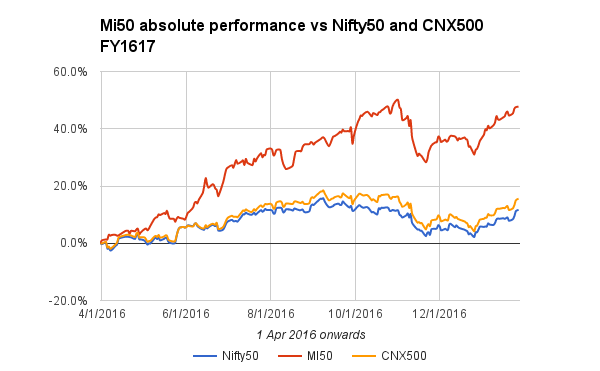
The out-performance as mentioned before took a small beating, but nothing big really.
The drawdown is now tantalizingly close to the zero mark. 7 weeks is all it took to recover most of the loss. The DD stands at 1.52% vs 3.59% last week. 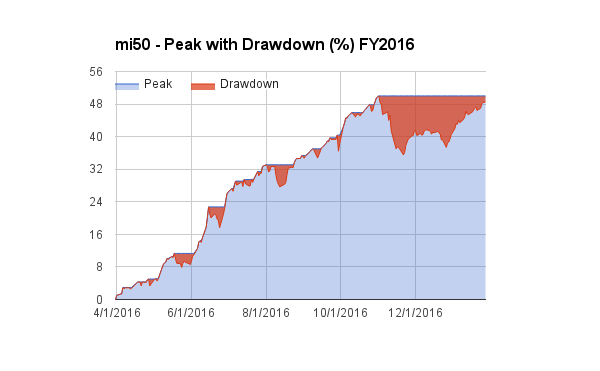
The top 5 performers in the strategy now are:
| JAYBARMARU | 78.16% |
| HINDZINC | 80.72% |
| JKPAPER | 86.00% |
| RUSHIL | 103.92% |
| STARPAPER | 115.23% |
and the bottom 5:
| PROZONINTU | -24.61% |
| BARTRONICS | -13.19% |
| GOLDENTOBC | -10.22% |
| KIRLOSENG | -4.95% |
| AMRUTANJAN | -4.25% |
The internals of mi50 remain extremely healthy:
| Curr Trades | Wins | Avg | Losses | Avg |
| 46 | 39 | 31.67% | 7 | -9.03% |
| Exits | Wins | Avg | Losses | Avg |
| 60 | 38 | 32.48% | 22 | -8.58% |
I would like to hear from you readers, how are you doing in your respective systems. I encourage you to build a platform like this and showcase your results. Besides the self accountability and the audit able trail, it does help in sticking to the strategy. Who knows what the future may behold if your strategy succeeds.
Have a Happy Weekend!


Wonderful portfolio which bet most of the mutual funds returns by huge margin. Superb!!
Possible to post a Mi50 online link which can be accessed anytime?
Tks for your kind words. I did not understand the online question.
If it is to do with live performance, it was taken off due to security issues. But will remain updated end of week. and one can get performance mid week through my tweets etc
Well i experienced a dd of abt 27% and since then gained abt 26%…still abt 7-8% away from the pf highs…goes to show the importance of having a shallow dd..
Would love to start a similar blog ..but wondering how to start since i wont be starting from zero…should i take the buy price as the closing price as of this week or the my actual buy price?
Yes. just start anywhere end of week. It will only be in medium term that performance really will stand out.
As usual you are doing excellent Alok.
Me and My system has been wrong in expecting correction in Nifty and market since last 8-10 days. Never expected 8400+ NS.
My portfolio made on 1-June-2016 is up 39% till date. I have only 4 stocks (From 4 sectors) picked by my system on 1-June-2016 and 100% invested all times with 18-24 months view. Except PSU bank rest 3 sectors have done well – Cotton yarn, Chem/Agrochem Exports and Steel Pipes. My system not suggesting any change in portfolio as of now. In fact System is suggesting super returns in PSU Banks starting Mar 2017 so I am guessing Nifty will correct by Mid Mar 2017 😉
Sirji 39pct since june is awesome. Congratulations.
Would like you to give pointers to develop a more boad based sectoral system.for example, Mayb like have 15 to 20 sectoral themes. Have 3 to 5 stocks in each. Rank them based on “some criterion” and then buy them in proportion to weights etc..
I want to build several models apart from mi50…so looking for ideas. Tks
Come on I am not that old to be called sirji :-).I am junior to you.
My system is complex system and takes multiple macro data points of past like say rate of inflation in India/US, India/US 10-years yield, SBI Home loan Rate/PLR, Current and Fiscal Deficit/Surplus, USDINR, EURUSD, JPYUSD, Sensex PE, SP500 PE, Sensex PB, SP500 PB, Dollex 30, MSCI EM Asia Index, NPA % for Banking sector, Price of Industrial commodities – Crude, Copper, Steel Price of Agri Commodities – Rice, Sugar, Cotton, Soya and so on. It will peak top 5 sectors which will do well in given macro environment.
If you do not want to get in to macro data check Karanb_k ‘s blog, I liked his approach as well. He will first pick only those sectors which are above 40 weeks MA. Then he ranks all positive sectors based on relative out-performance (ratio) against each other from 1 to 10. Like say if Metal is relatively out-performing other 9 sectors Metal is Rank 1 and so on.
Hi..Follow you on Twitter. Can you share the excel you maintain to come up with your metrics…With dummy data of course.I would like to use the same to input for my system..And see the results.
Hi. I dont have any system metrics on excel. Only purchase and sale data and pct change
Hi Alokji, I appreciate your efforts in taking time to showcase your model and updating it regularly for your readers. Since you are quite regularly buying and selling, I wanted to ask you if you would consider the gains in this portfolio as stcg or as business income while filing taxes. Would you say that it’s upto the investor to decide if all trades are delivery based? I would love to here your comments and suggestions on this.
Regards,
Santhosh
Hello Santosh, Thanks for your kind words. I am not qualified to comment on taxation.