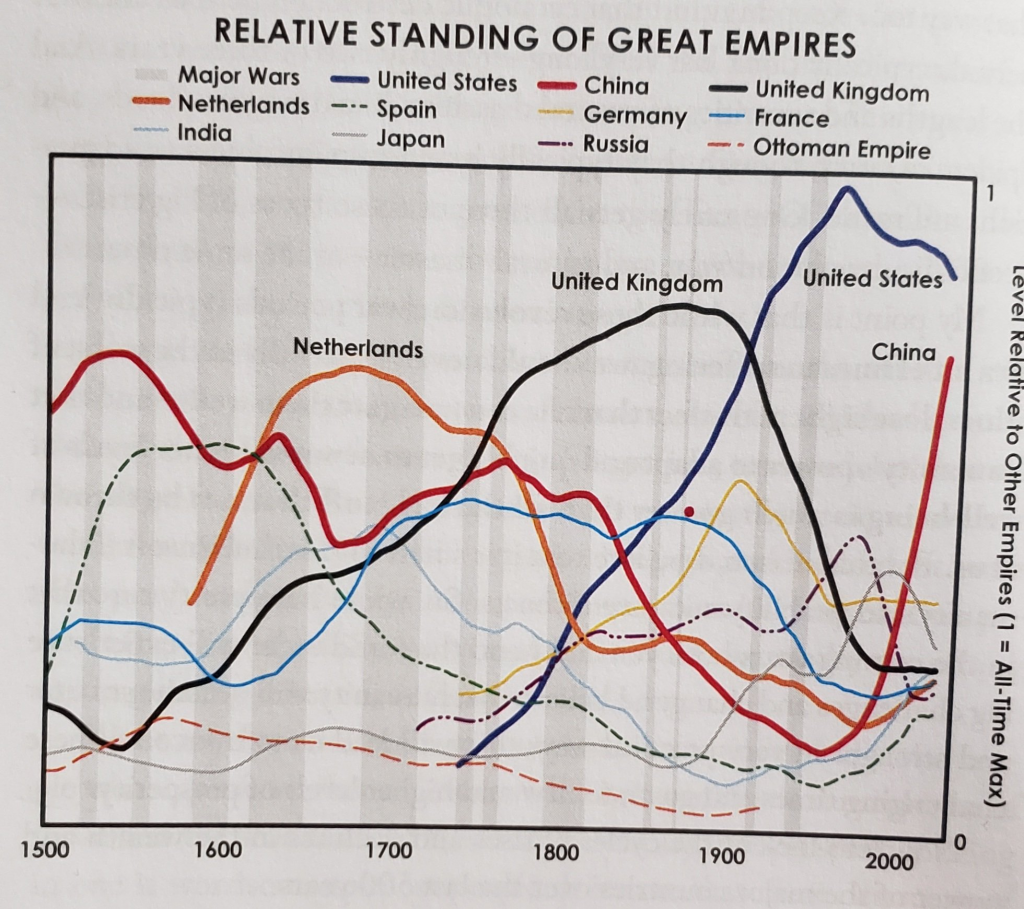
A fascinating graphic from Ray Dalio’s book shows the relative standing of great empires over the last 600 years. This chart spans from 1500 to the present, tracking the rise and fall of various economies. The scale runs from zero to one, indicating how well each economy performed relative to others. It reveals a lot about the shifts in global power over the centuries.

China’s Dominance and Decline
In the 1500s, China was at the top of the global economy. It remained dominant until the mid-1500s, when it began to decline. As China started to fall, Spain’s power was on the rise. The Spanish era peaked in the mid-1500s and lasted until the early 1600s. However, Spain’s dominance waned after 1650, and it experienced a long period of decline until recently.
The British Empire’s Growth
During the same period, the United Kingdom began its rise. From the mid-1500s, the UK embarked on a trajectory of growth that marked the colonial era and the spread of the British Commonwealth. This rise continued well into the 20th century. The chart shows that the British Empire maintained its position until it started to decline gradually in the 20th century.
The Emergence of the United States
The United States is a relatively new player in this historical chart. The US emerged in the mid-1700s and grew rapidly. By the 1960s and 1970s, it reached its peak. However, the chart indicates that the US has been on a gradual decline since then. Despite this, the US remains a major global power.
Other European Empires
The chart also highlights the rise and fall of other European empires. The Dutch Empire, for example, rose in the mid-1700s and ruled until it collapsed in the early 1800s. Similarly, Germany rose to prominence in the mid-1700s, peaked around 1900, and then declined post-World War II. France experienced a similar trajectory, rising from the 1600s and remaining stable until the 1900s before declining.
India’s Historical Journey
India’s line on the chart shows it was doing well until the 1700s. However, the period of colonialization led to a significant decline, reaching its lowest point. In recent times, India has begun to ascend again. While the ascent may not be as rapid as China’s, India is on a positive trajectory. The historical pattern suggests that India’s growth could be a long, gradual process, but it is on the right path.
The Cycles of Empires
The graphic underscores the concept that no empire stays at the top forever. Each empire rises, reaches its peak, and eventually declines, allowing others to take over. This is akin to a relay race happening over centuries. While China and India are currently on the rise, other empires like Russia are also beginning to recover after long declines.
This historical perspective is crucial. It teaches us that economic and societal progress happens in long cycles. No economy stays at the top indefinitely, and no economy remains at the bottom forever. The natural progression of societies and economies plays out over centuries, demonstrating resilience and the potential for future growth.

Disclaimers and disclosures : https://tinyurl.com/2763eyaz
If you have any questions, please write to support@weekendinvesting.com


