Mi NNF 10 Prices are going to be increased from 01 Apr 2024
Effective 01 Apr 2024 , Mi NNF 10’s subscription fee will be increased for the first time since launch.
This adjustment is necessary to ensure that we can maintain the high-quality standards and provide you with the best possible investment experience.
Old Pricing : Rs 2,499 (Quarterly) | Rs 7,499 (Annual)
New Pricing : Rs 3,333 (Quarterly) | Rs 9,999 (Annual)
Watch this special video to know more
For Current Subscribers of Mi NNF 10
Nothing changes for current subscribers at all. You shall continue to enjoy access to the strategy at your current subscription fee as long as you do not break your subscription loop. Kindly ensure that you renew your subscription on time.
For those who haven’t subscribed yet
This is a great opportunity to subscribe to Mi NNF 10 at its current pricing. Use the link given below to subscribe.
- The WeekendInvesting Newsletter
- From the Research Desk of WeekendInvesting
- Markets this week
- Benchmark Indices & WeekendInvesting Overview
- Sectoral Overview
- WeekendInvesting Strategy Spotlight - Mi NNF 10
- Rebalance Update
- WeekendInvesting Strategies Performance
- WeekendInvesting Products – LIVE Index Data
- WeekendInvesting Telegram and YouTube Channel
- Introducing M Profit
The WeekendInvesting Newsletter
Another brand new initiative from our Research Desk is The WeekendInvesting Newsletter. This is a daily newsletter that summarizes all the stories we cover during the day(market nuggets), including the daily byte that we shoot every evening. This newsletter will be delivered to your email every evening on market days, providing you with a wealth of market-related information. The newsletter includes both summaries and long-form blogs for all the market nuggets covered. These blogs are also linked to the videos we shoot, so you can choose to watch or read the content according to your preference.
Check out our past newsletters.
From the Research Desk of WeekendInvesting
You must continue to invest in Smallcaps Always!
Recently, an intriguing image surfaced on Twitter, capturing the attention of many investors. This image, derived from a study conducted by the DSP group using Motilal Oswal data, sheds light on the performance of small-cap stocks over the past five years. Surprisingly, the findings reveal that most small-cap stocks exhibited a modest Compound Annual Growth Rate (CAGR) of 7%, with only a handful transitioning into mid caps or large caps with significantly higher CAGRs.
Are you invested in a Ponzi Scheme ?
The term “Ponzi scheme” has become synonymous with fraudulent investment practices, but have you ever wondered about its origins? Let’s delve into the history behind this infamous name and understand how it continues to deceive investors worldwide.
Have you used this cool feature on WeekendInvesting website ?
Weekend Investing’s website offers a treasure a bunch of interesting features, but one gem often overlooked is its analytics page. Here, investors can conduct various studies on different strategies, compare indices, and even simulate portfolio combinations to assess performance over time. By navigating to the analytics page on weekendinvesting.com, users can explore the performance of different strategies and their combinations.
Are we staring at increasing Domestic liquidity in the coming decade?
The data released by RBI and analyzed in the Goldman Sachs report reveals a significant trend in Indian household financial assets, particularly in shares. Over the past few years, there has been a remarkable increase in the flow of liquidity into the stock market from household financial assets, indicating a structural shift in investment behavior.
ALWAYS ALWAYS invest in the markets!
A recent chart shared by Funds India Research sheds light on the tumultuous journey of the Indian stock market over the past 34 years. From geopolitical crises to financial scandals, the market has weathered numerous storms, each accompanied by its share of panic and uncertainty.
Are you ready for a bear market ?
In the world of investing, it’s easy to get swept up in the excitement of bull markets, where optimism reigns supreme, and profits seem endless. However, what many investors haven’t experienced in the past decade and a half is a prolonged bear market – a period of sustained market decline that tests even the most seasoned players.
Momentum is the only saviour in this world of disruption
In a recent report by Bradley Saacks of Bank of America, an intriguing revelation surfaced: the number of workers needed at S&P 500 companies to generate a million dollars in revenue has significantly decreased over the last three decades, from seven to two. This data sheds light on the evolving landscape of corporate efficiency and productivity, hinting at the pervasive influence of technological advancements and operational optimization.
Is Following Promoter Buying – a TRAP ?
Promoters buying their own company’s stock often sparks excitement among investors, who see it as a positive signal for future performance. However, there are several nuances to consider before jumping to conclusions based on promoter activity alone.
The head and shoulders pattern is a widely recognized pattern in trading circles, known for its strong predictive power. Looking at the chart of Bitcoin, we can clearly identify the characteristic shape of this pattern, with a left shoulder, a prominent head, and a sharp right shoulder.
TSLA : Is the EV story going down ?
In the world of investing, stock price movements often lead investors to believe that a trend will persist for an extended period. Take Tesla’s chart on Nasdaq, for example. From 2014 to 2020, the stock remained relatively flat, hovering around $20. Then, there was a sudden surge to $80 before plummeting back to $20 amid the pre-COVID period. This rollercoaster ride left many investors uncertain about their positions.
Markets this week
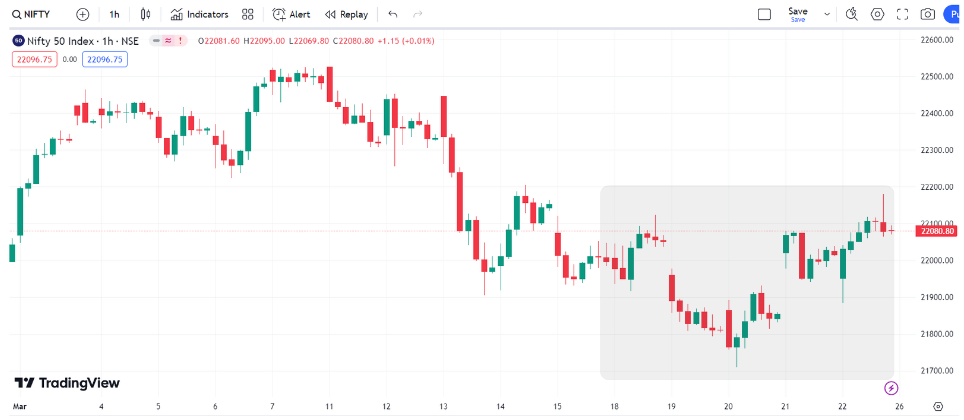
Nifty 50 is virtually at the same level at the end of this week compared to where it was in the previous week. But there was a strong dip as a part of continuation of the short term downward trend taking the index all the way to 21700 where it found support and recovered eventually. If you observe on the hourly chart, there’s an inverse head & shoulder patter which indicates a potential upward trend. Once we break above 22200, we can certainly see a strong rally potentially taking Nifty 50 to a fresh ATH while the right shoulder at 21900 will be an important level on the support front breaking below which the pattern shall be negated.
Benchmark Indices & WeekendInvesting Overview
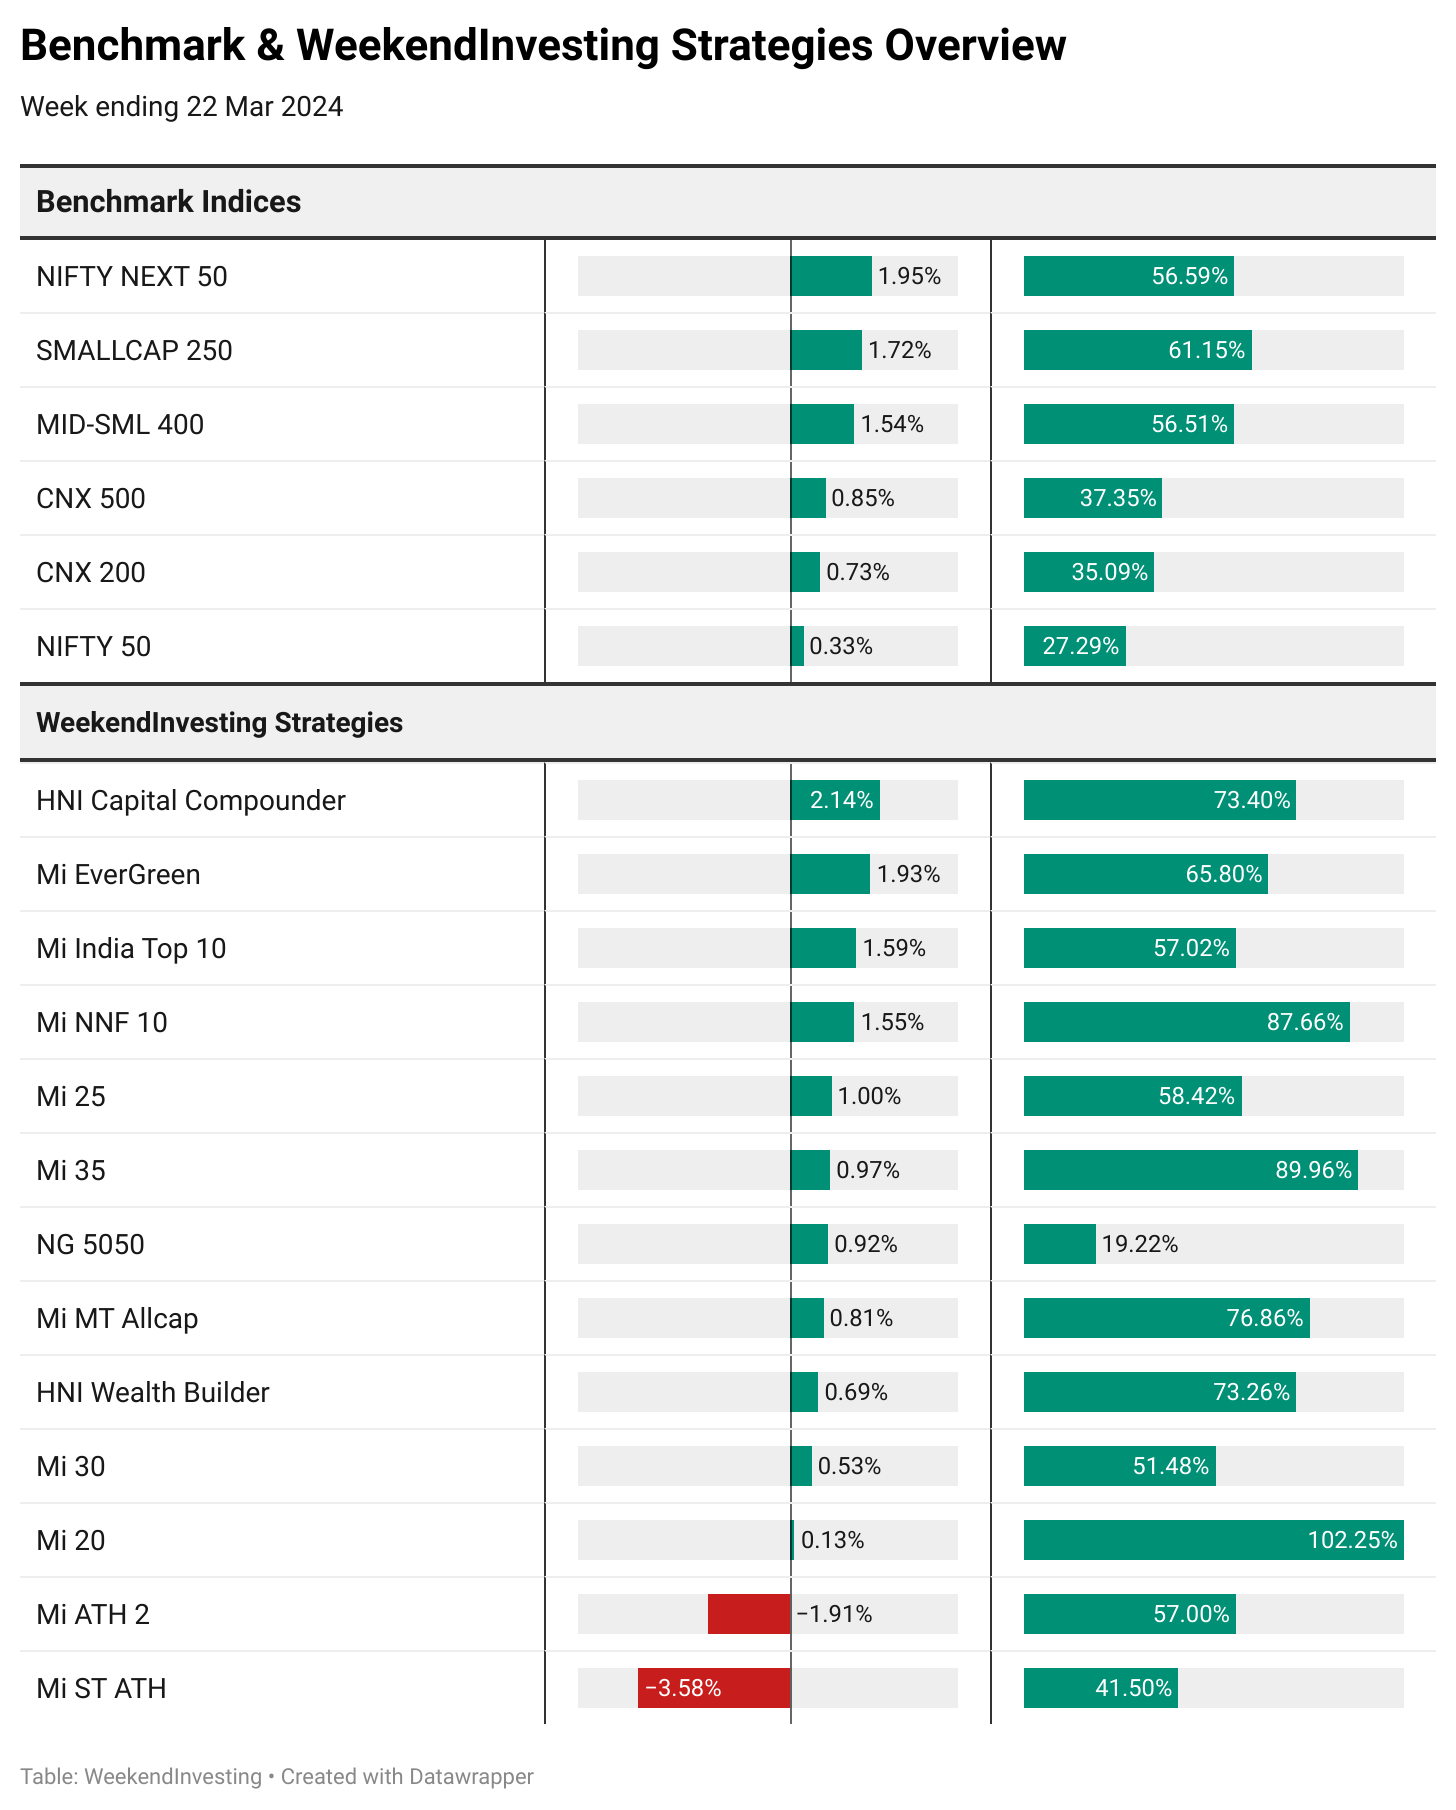
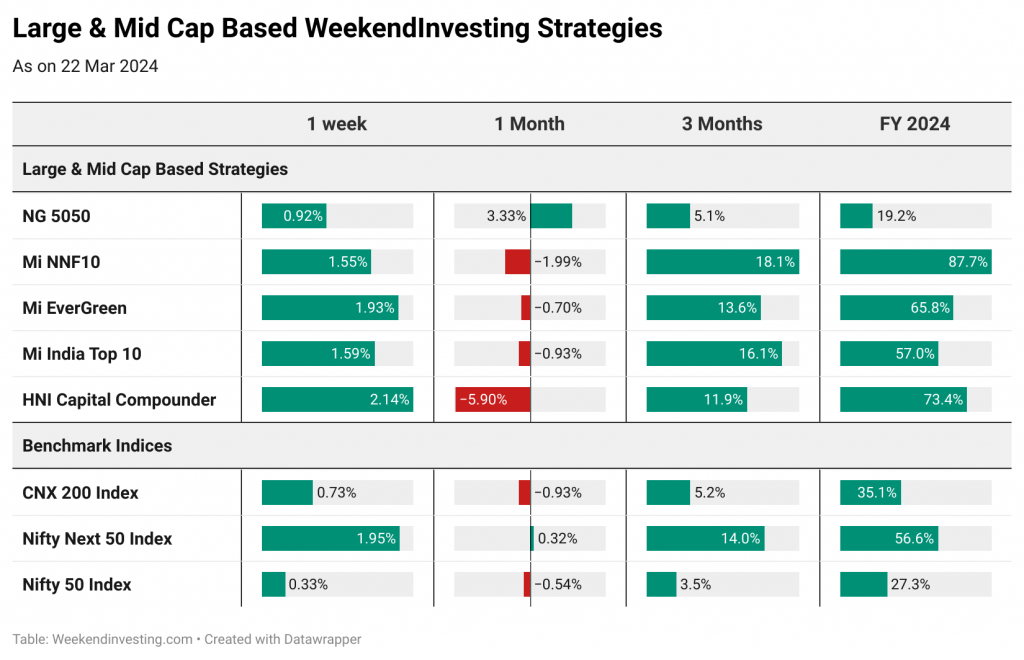
Nifty Next 50 (also called as Nifty Jnr) is the surprise package this FY 24 with performance on par with the Midcaps and Smallcaps at 56% which is just incredible for a large cap index. This week, Nifty Jnr clocked a solid 1.95% staging a decent recovery from the recent slump followed by Smallcap 250 and Mid-Small 400 at 1.7% and 1.5% respectively. Nifty 50 was neutral at 0.3% and also occupies the last spot on the FY 24 chart with 27% gains.
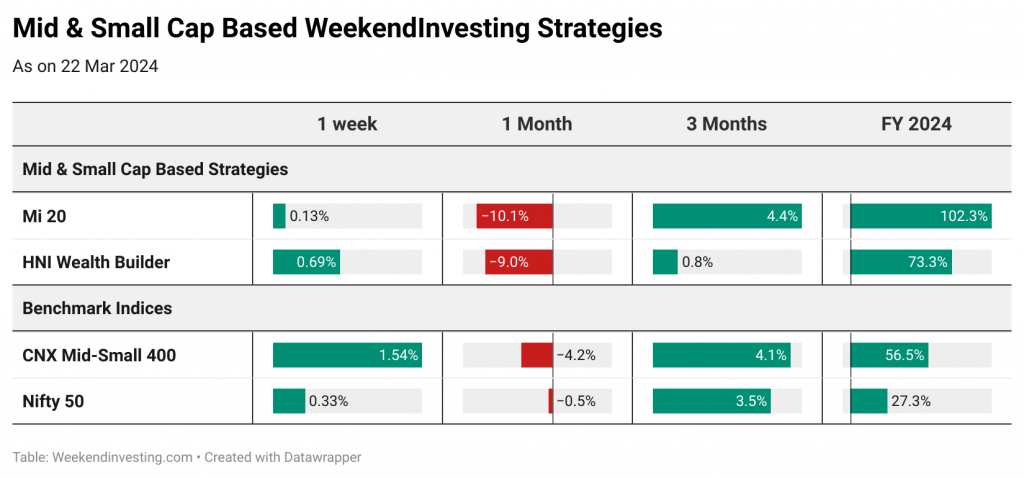
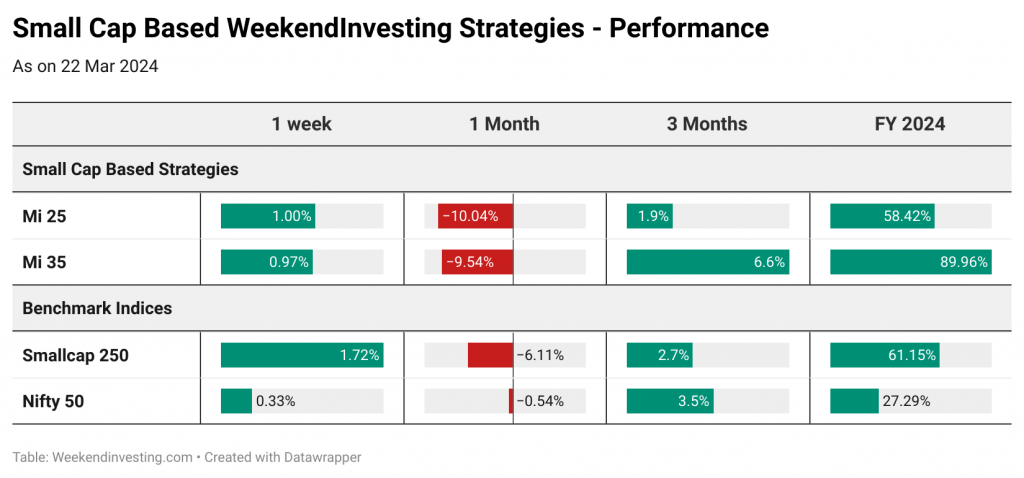
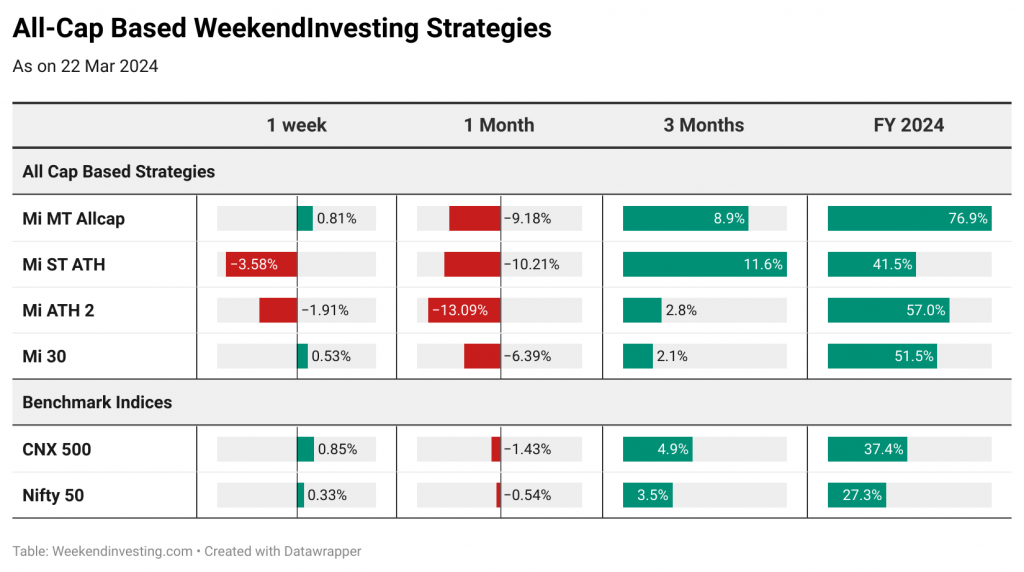
WeekendInvesting strategies did well to recover from the recent correction. HNI Capital Compounder clocked 2.1% followed by Mi EverGreen at 1.9%. Mi India Top 10, Mi NNF 10 and Mi 25 all did well to return in excess of 1% while rest of the strategies were in the mildly positive territory barring a couple that underperformed. With just one week to go for the conclusion of FY 24, all strategies look very good with Mi 20 leading the charge at 102% gains followed by Mi 35 and Mi NNF 10 at 89% and 87% respectively. All strategies have done extremely well to outperform their respective benchmarks too. More on this next week.
Sectoral Overview
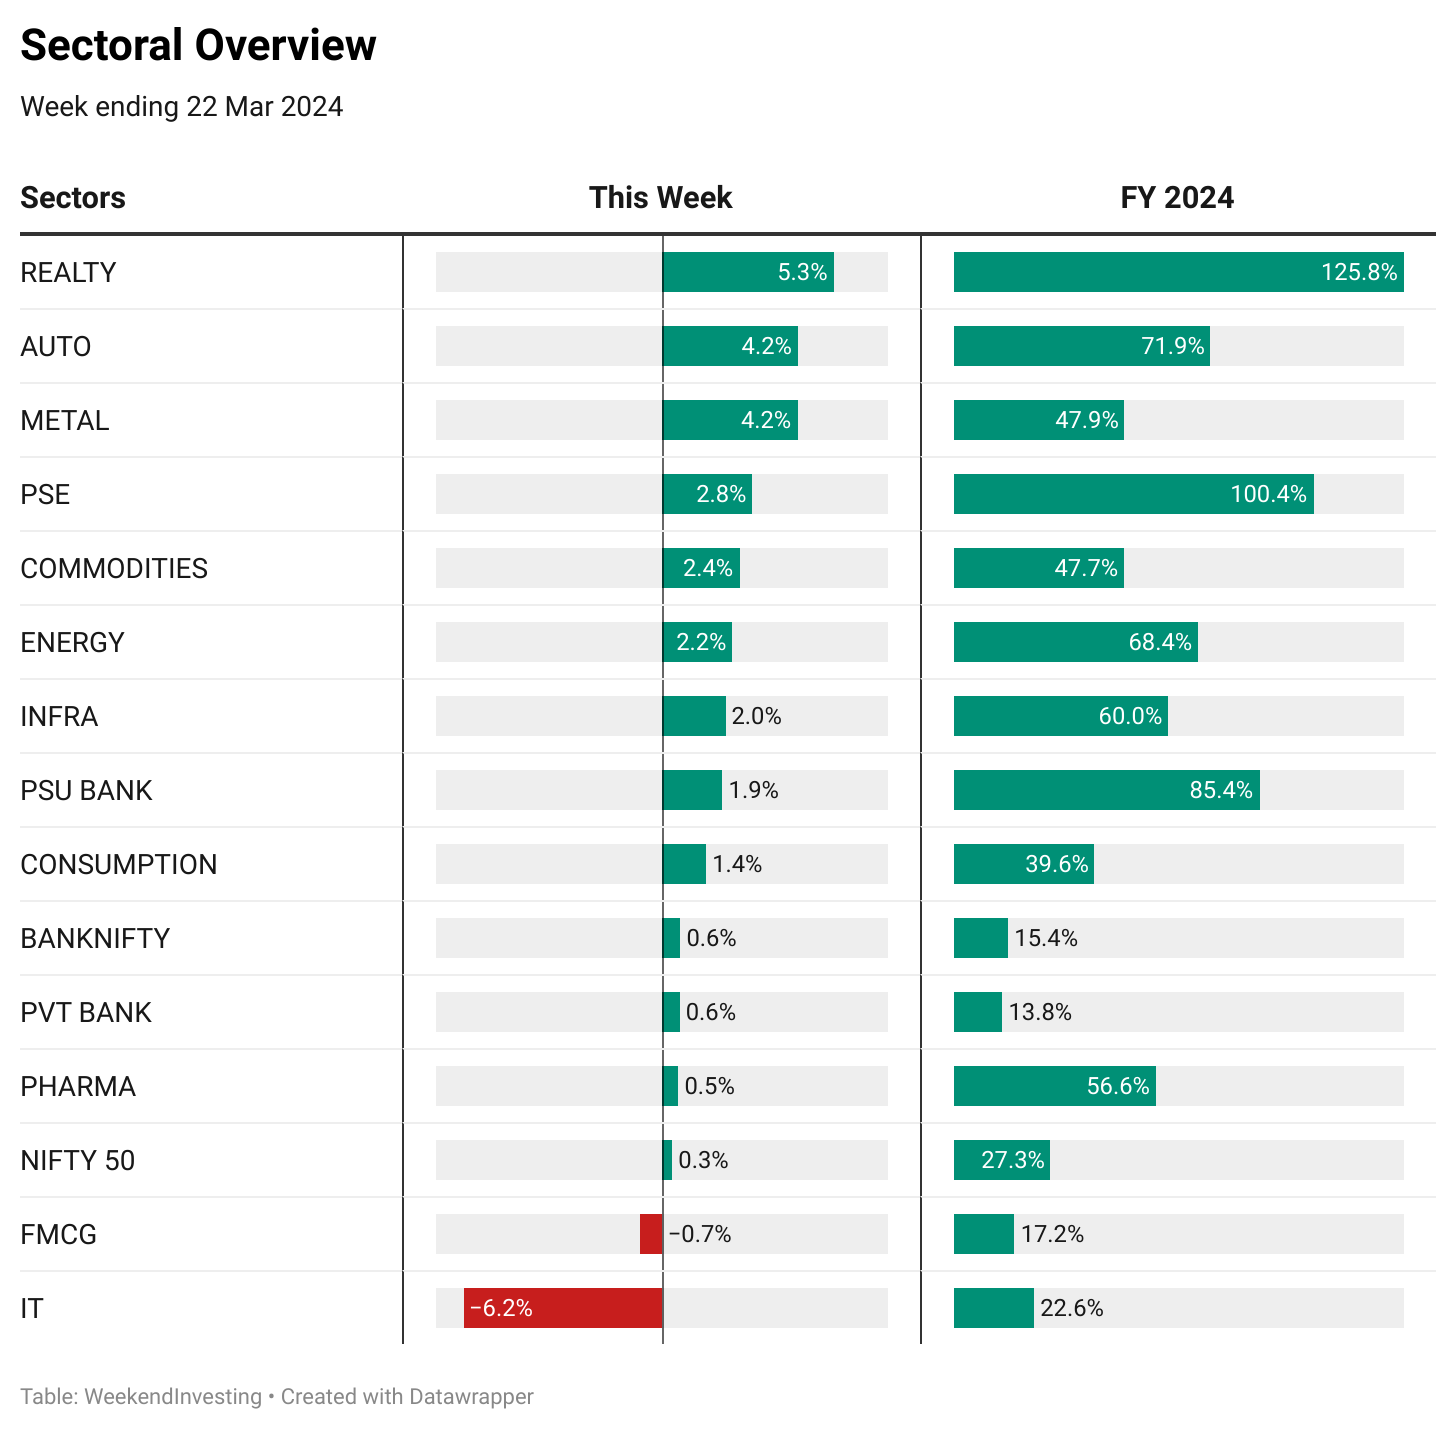
REALTY did well to clock 5.3% this week followed by METALS and AUTOs at 4.2%. Most of the sectors did well to recover from the slump barring FMCG and IT which were weak and -0.7% and -6.2% respectively. REALTY, PSE, PSU BANKS and AUTOs are the top performers as far as the FY 24 performance is concerned while FMCG, IT and BANKS have not the best outcome though.
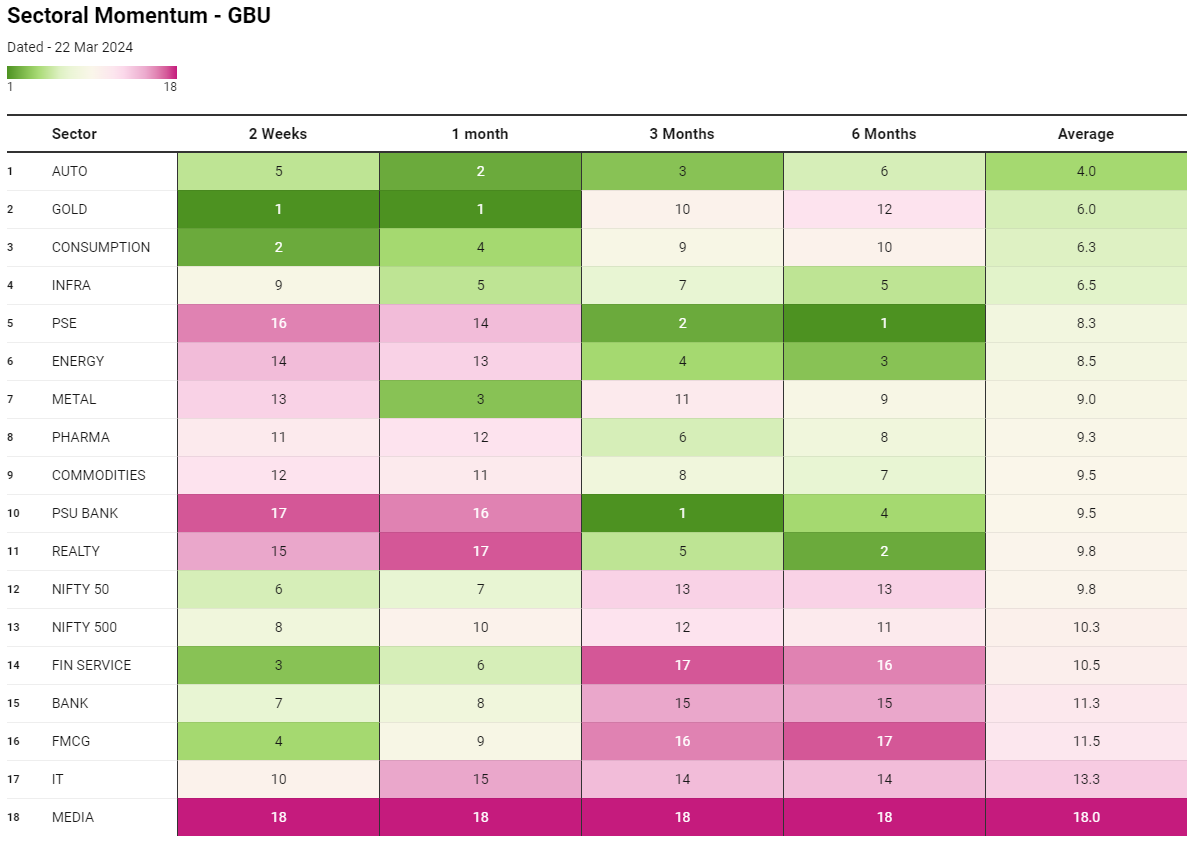
GOLD is right on top when you consider the fortnightly and the monthly performance. This speaks volumes about how the metal does every time the markets look pessimistic. AUTOs have performed exceedingly well on a consistent basis to occupy the top spot as far the overall average momentum score across all timeframes is concerned. Top performers this FY 24 – PSE, REALTY, ENERGY and PSU BANKS saw maximum damage in the last couple of weeks slipping down to the bottom of the fortnightly chart. REALTY & PSU Banks have taken a very hard beating in the recent short term occupying the bottom few spots across the 2 week and 1 month chart despite being the top performers in FY 24.
WeekendInvesting Strategy Spotlight – Mi NNF 10
Mi NNF 10 has performed exceptionally well right since the strategy went live on 12 Nov 2020.

In the last 1 year, the strategy has returned a massive 88% compared to 56% on the Nifty Jnr index. Performance since 12 Nov 2020 (3 years and 4 months) is solid at 157% compared to 102% on its benchmark.
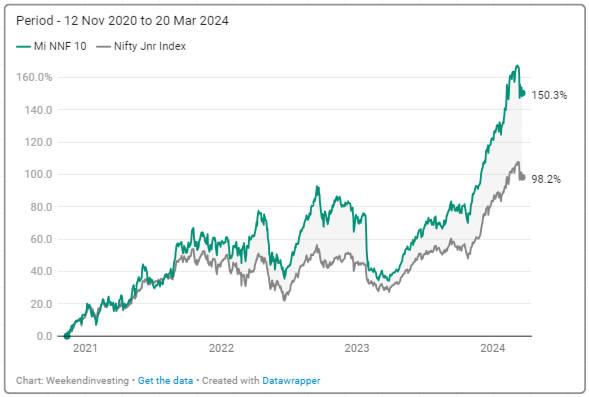
Mi NNF 10’s CAGR is at a superb 32% against 23% on Nifty Jnr.
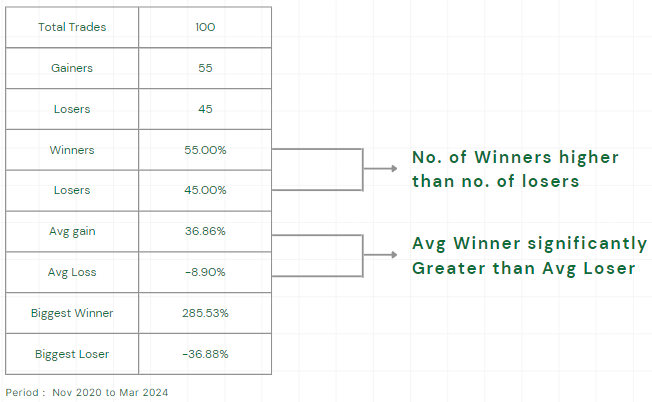
The % of winners is only at 55% but the most important point to note is that the average winner gets you 36% while the average loser takes away about 9%. The highest winner was at a gain of a massive 285% while the biggest loser was at a loss of 36% only.
The subscription fee for Mi NNF 10 increases to Rs 9,999 from Rs 7,499 effective 01 Apr 2024. So please do make use of this opportunity if you are still not subscribed.
Rebalance Update
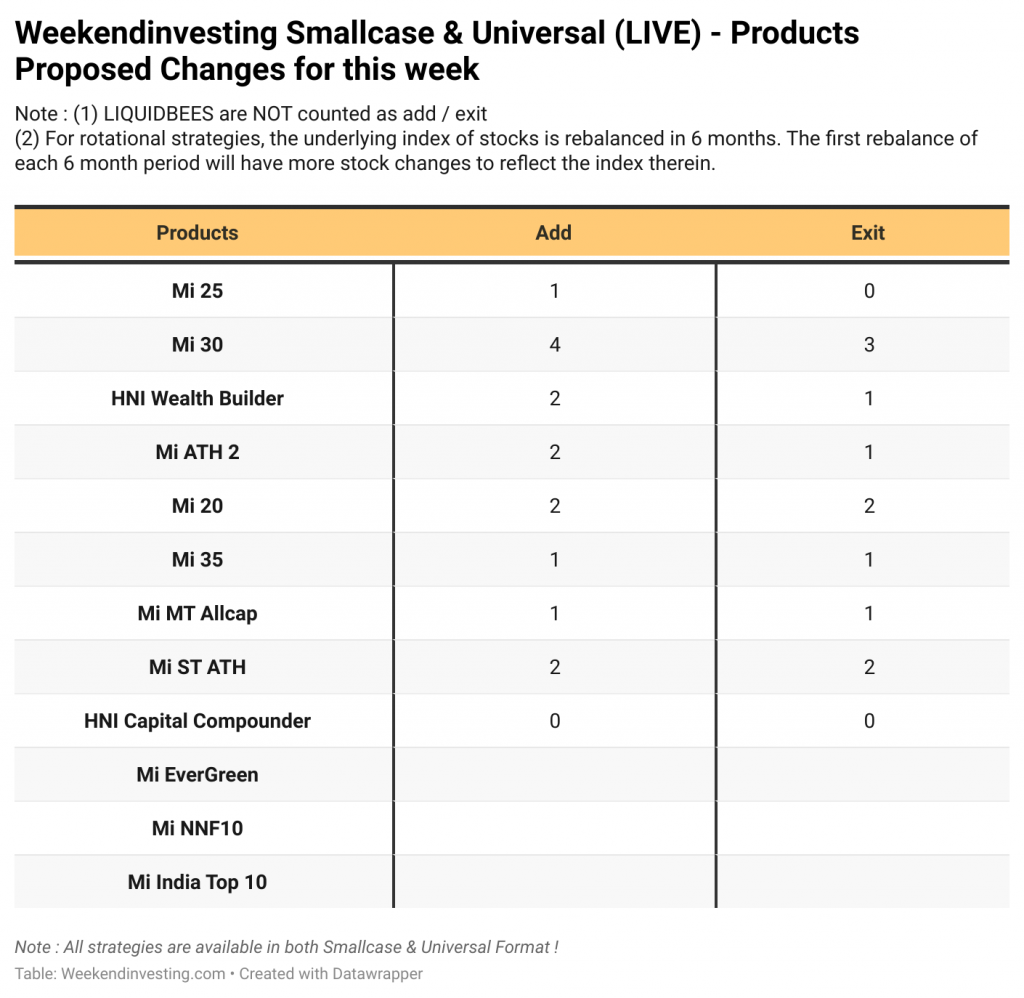
We give advance notice here on the upcoming changes in your smallcase for Monday. This advance notice can be used to ignore Monday’s update if there is no change. If there is a change indicated you can use the smallcase app or log in to weekendinvesting.smallcase.com to see the rebalance. A backup email is sent by mid-day Monday if you have not rebalanced by then and yet another one a
Note: We are not including LIQUIDBEES as an ADD or an EXIT count.
WeekendInvesting Strategies Performance
WeekendInvesting Products – LIVE Index Data
Many of you had asked us to make the index series of all WeekendInvesting Products available so that you could perform your own analysis and studies. You can find a link to the LIVE sheet here and also on the HUB under the support column in the content tab.
WeekendInvesting Telegram and YouTube Channel
We post daily content related to investing on our Weekendinvesting Telegram Channel and YouTube channel to help our community take stock of the performance of markets, sectors & our products and touch base upon a new topic every day. We look forward to having you all there! Several videos in this blog are from this series.
Introducing M Profit
That’s it for this week. See you in the next week’s report.


